OpenStreetMap

DrishT's Diary

Recent diary entries

As some of you might know, Facebook has been using machine learning algorithms to help human mappers edit and validate geometry faster. Over the past year, we have completed mapping all the roads in Thailand and most of Indonesia. Watch the video below to see the progress.

Video on Thailand Mapping

Based on this work, many NGO’s, local communities, and tech companies have requested the data, which we have been sharing when available, like we did for last year’s Kerala Floods to help with disaster response. In the case of disasters, many enthusiastic OSM volunteers offer up their time to help fill in an area’s missing data. However, new volunteers often encounter two challenges: it’s hard to get started quickly and there’s a steep learning curve to master high-quality edits. To address these challenges, we’ve created a version of the primary OSM iD editor that we call RapiD to helps every mapper make edits quickly using roads suggested by our Map With AI service. It also has strong integrity checks to ensure edit quality. Special thanks to the original makers of the iD tool for building an incredible foundation.

In a previous diary, we shared our internal workflow for mapping using AI. Since that time, we have made some significant changes in order to allow greater accessibility and simplicity when working with the data. These enhancements and simplifications have coalesced into the current version of the RapiD editor. Over the next few weeks, we are happy to announce that we’ll start testing RapiD using the Humanitarian OpenStreetMap Assisted Mapping for Good Tasking Manager with selected partners to gather critical feedback. Based on that feedback, we will be exploring the possibility of opening the RapiD editor source code and how-to service documentation to the entire OSM community.

With or without AI assistance, mapping is a time-consuming process. It took our internal mapping team about a year and half to map all of Thailand, even with the AI roads speeding up the editing process. To improve global OSM coverage at a faster pace and in a more collaborative manner, we believe the best way to move forward is to team up with the whole OSM community and create tools that empower every mapper.

After spending a lot of time researching the mapping techniques and preferences of various OSM communities, we decided it was best that we change our workflow. While Facebook mappers have over a month of training to ramp up before they start making live edits in the map, this is not true for most other mappers. So, we focused on two major changes:

  • First, we needed to make our roads available on-demand for users. Our original process used static XML files that offered less flexibility in terms of task size and had to be uploaded all at once.Often times, OSM users only partially map an area and will upload frequently so as to not lose their edits.
  • Second, we needed to build a tool that was accessible and familiar to OSM users. The previous version of our internal iD fork was highly customized for mapping AI roads, but this came at the cost of different styling and hotkeys from official iD. Users would have been forced to relearn iD instead of just hopping in and immediately understanding what they saw. So, we worked closely with the developers of the original iD team to re-factor and created the RapiD editor, porting many integrity changes to both versions.

RapiD Editor

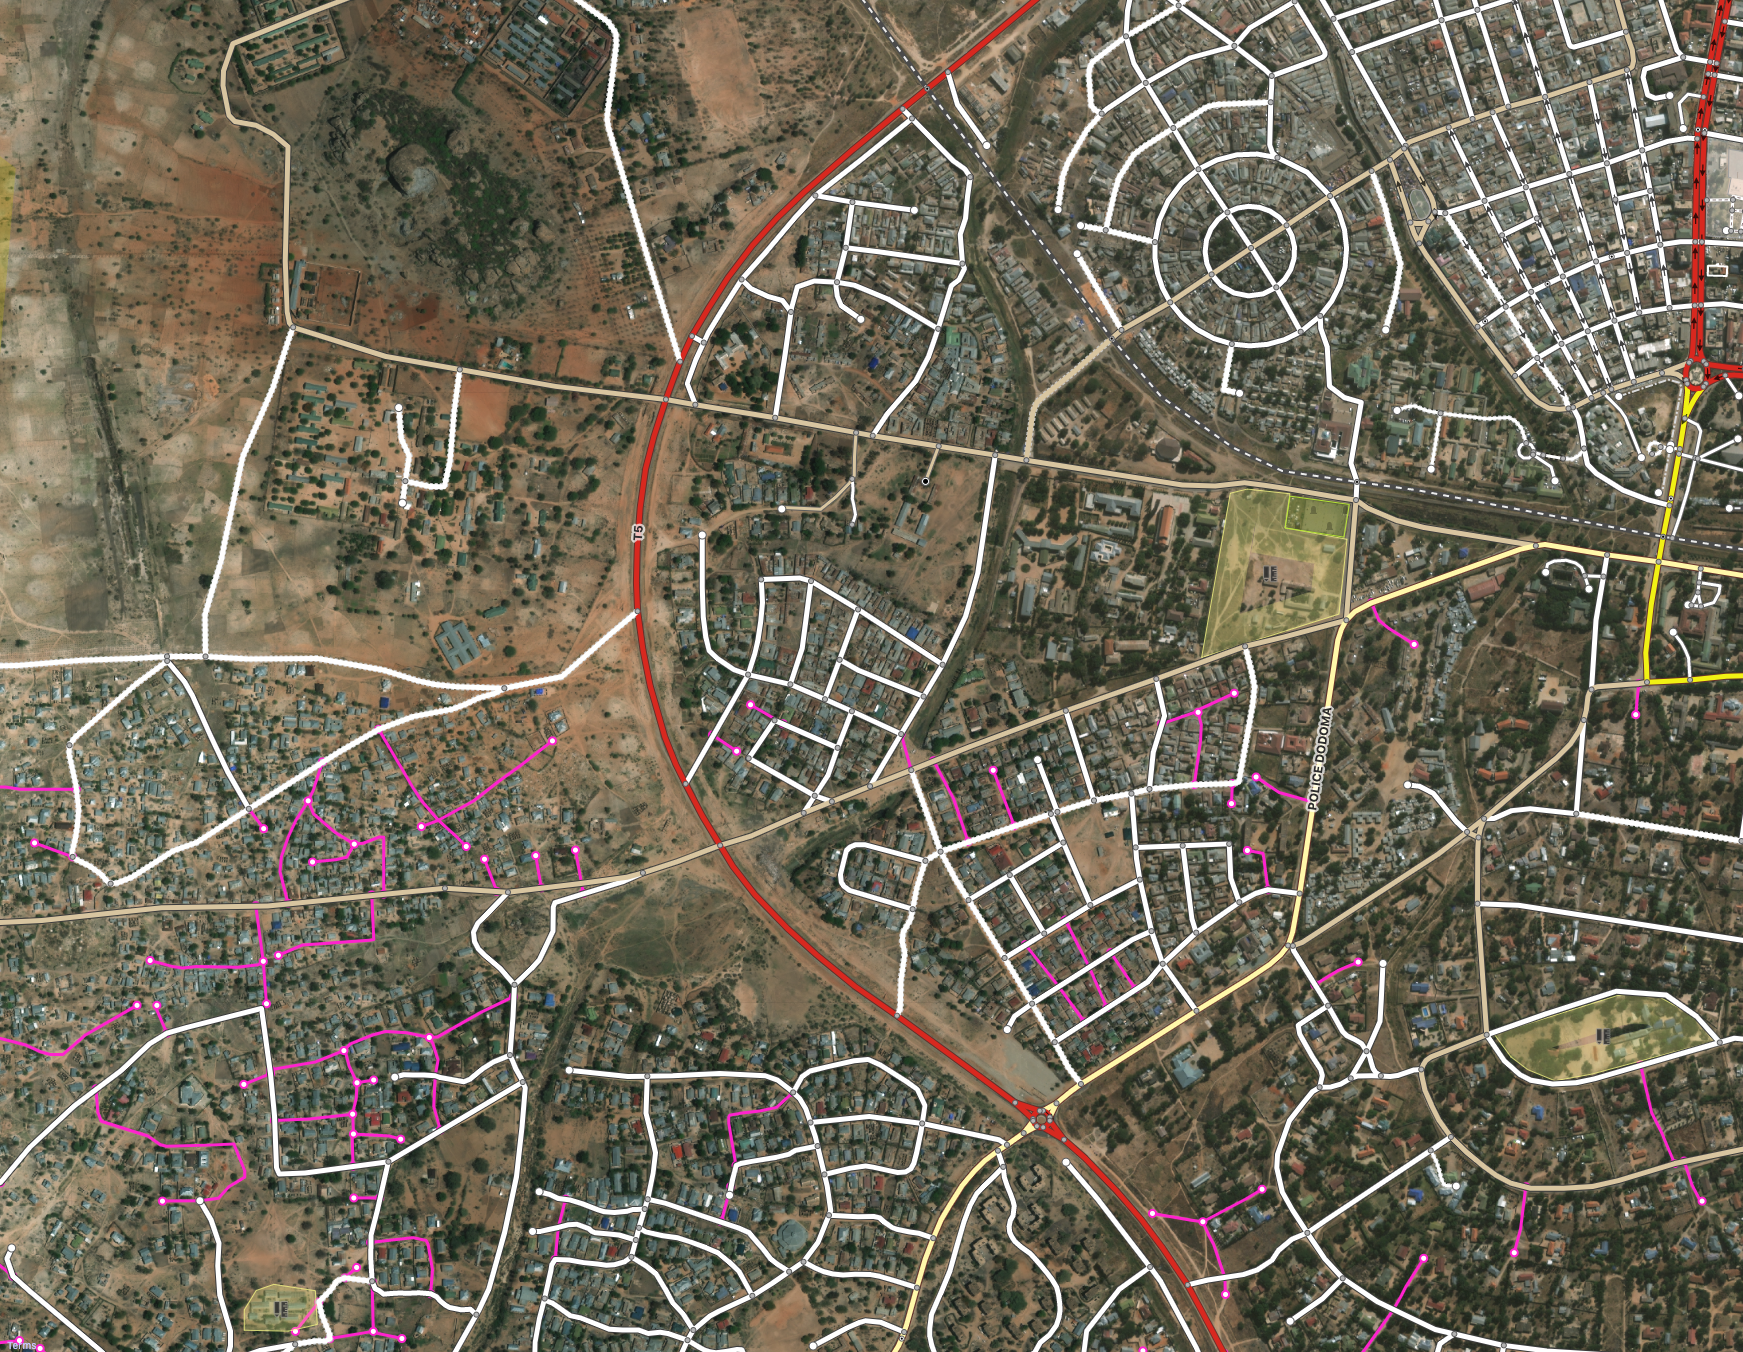
RapiD takes all the power of our AI-assisted mapping and makes it accessible to all levels of users. Upon opening a task area, the user will be presented with an additional RapiD Assist layer in magenta. These magenta ways are road predictions that a user can choose to add to the map. To avoid causing data errors, the predicted ways will automatically crop themselves at task edges. Furthermore, a round of real-time conflation is done to make sure they do not duplicate existing OSM roads. Any predicted road not specifically chosen for inclusion by the user will not be uploaded.

image_RapiD.png

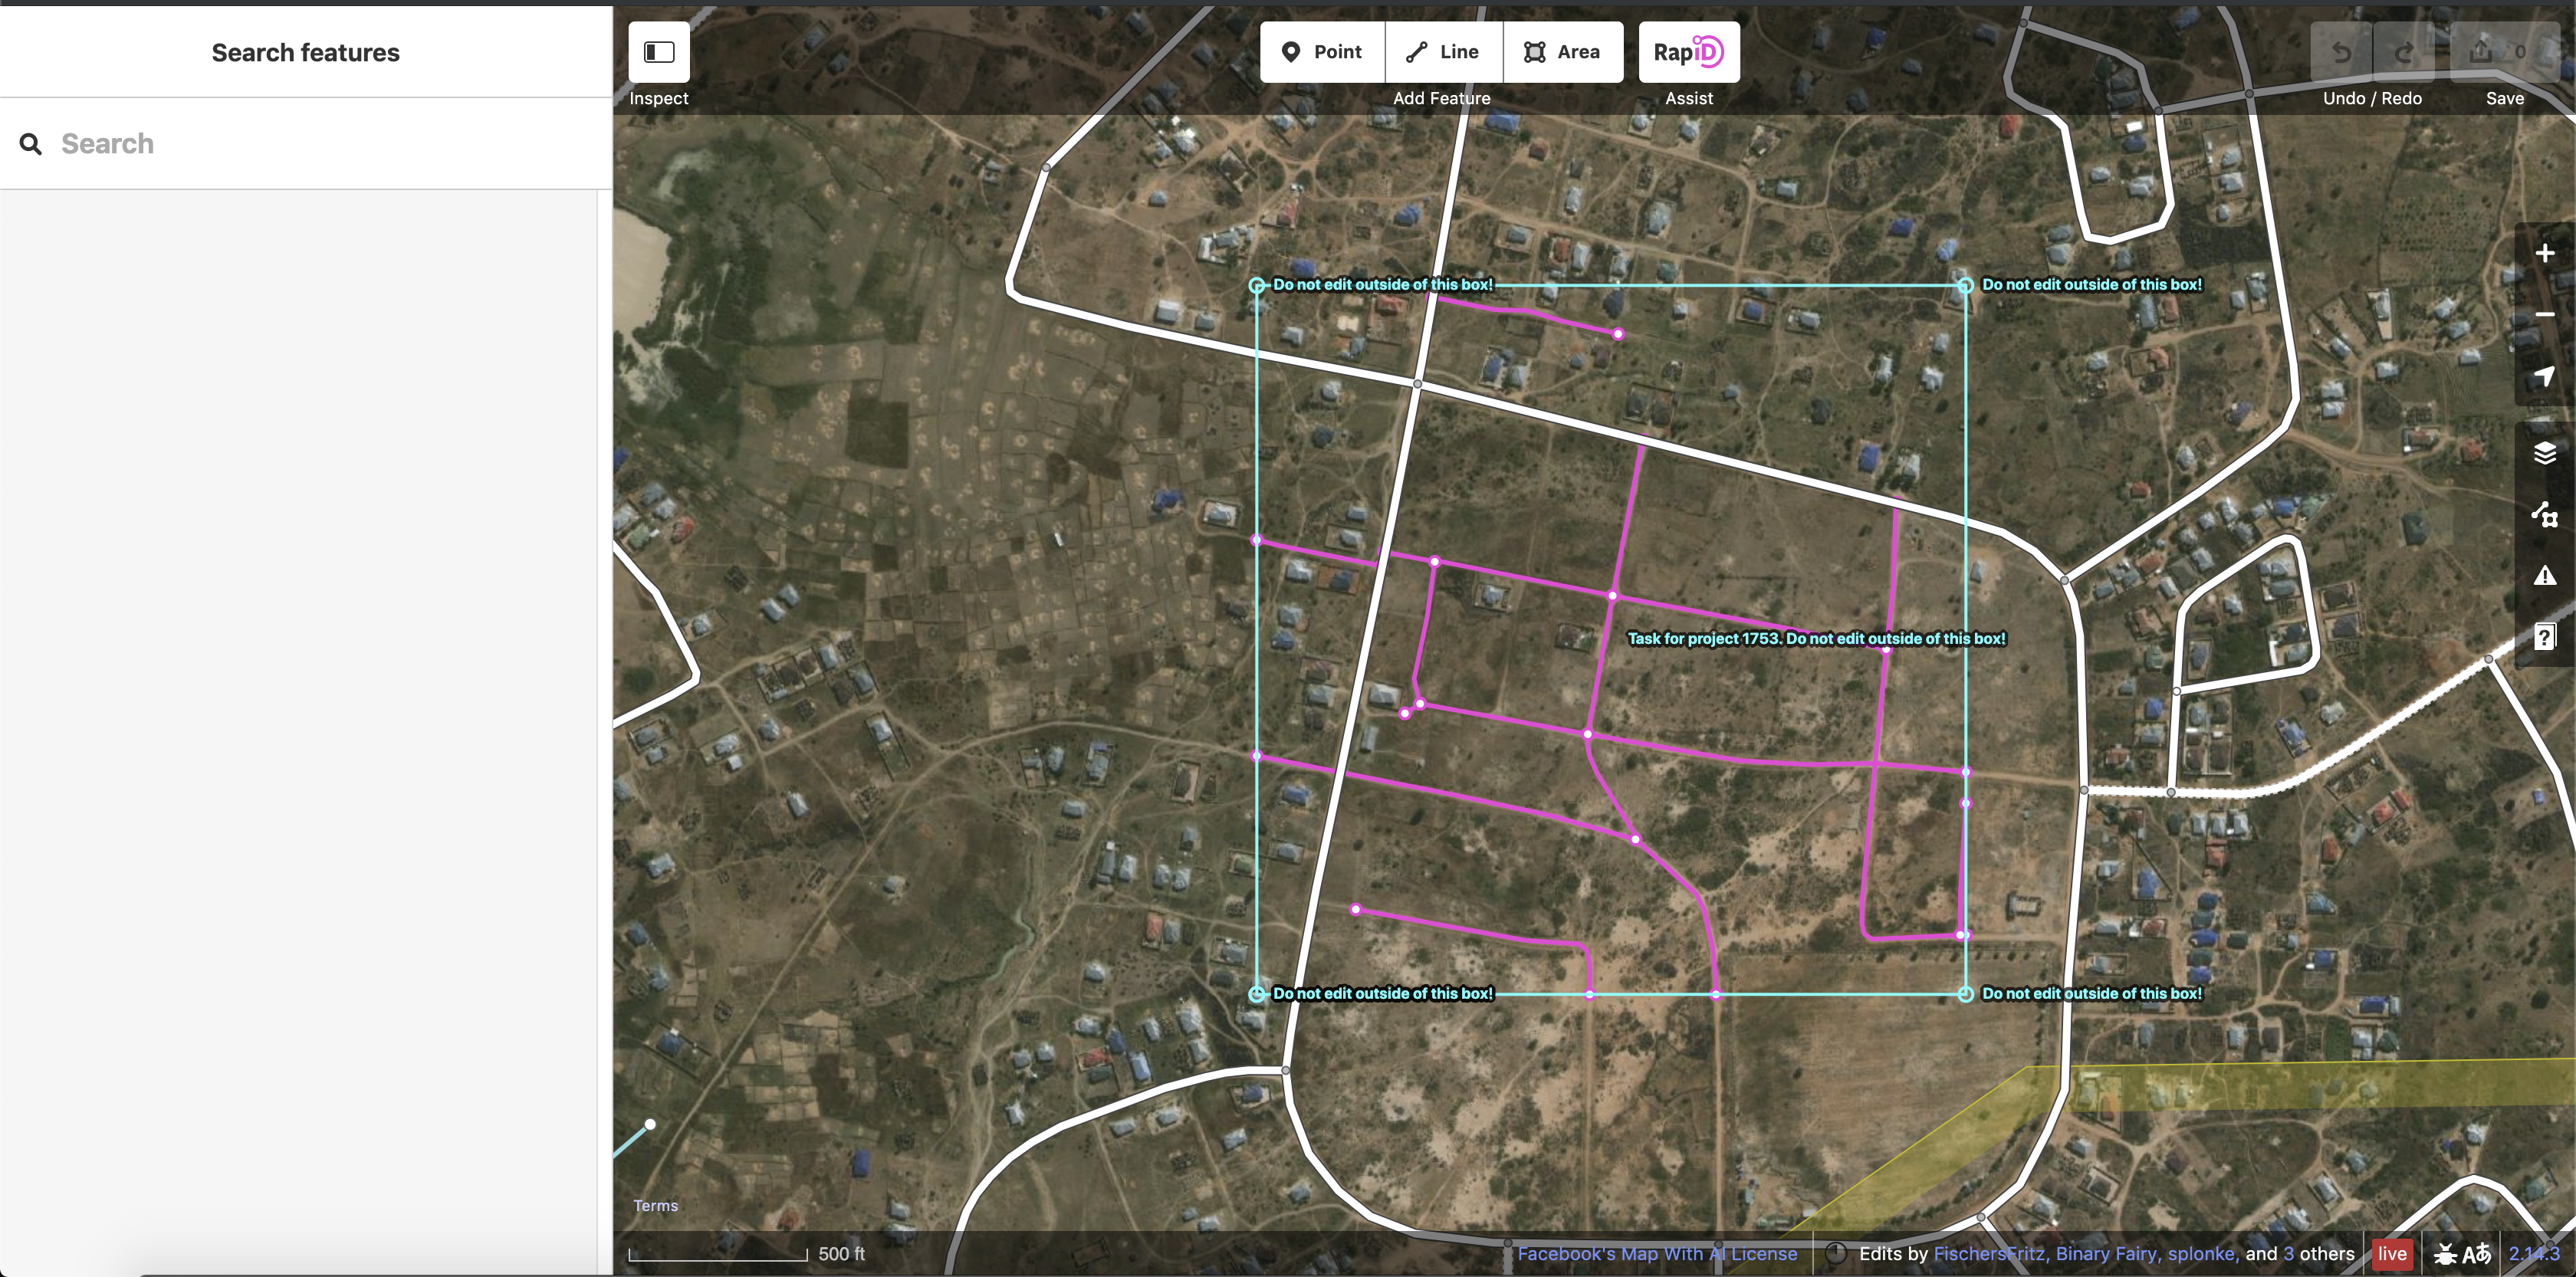
To use RapiD, a user selects a road then clicks “Use This Feature” to bring the predicted way onto the map. From there the feature is like any other newly digitized road and can be further edited as needed. add_ML_road.gif

If an editor decides they don’t want to use the predicted road, they can mark “Remove This Feature” to make it disappear. remove_ML_road.gif

To aid in tagging these newly created roads correctly, we have added a hotkey to cycle through the most common road tags. tagging.gif

The AI layer can be toggled on and off as needed. turn_off_ML.gif

So how do we actually generate roads from satellite imagery?

We use a type of machine learning called a Deep Neural Network segmentation model that we run against satellite imagery. The actual output of this is an image giving the probability of each pixel being part of a road. Bright magenta means there is high confidence of the pixel being a road, while transparent means there is low confidence. For a much more in depth look at this subject, check out our DeepGlobe Challenge website or research paper. Screen Shot 2019-05-08 at 11.50.31 AM.png

Once we generate this magenta output layer, we convert it from a raster image into a vector data format. Then we conflate this vector data with OSM and drop any predicted roads that already exist in OSM. The magenta roads available in RapiD are the final result of this post-processing. Screen Shot 2019-05-08 at 11.51.15 AM.png

Ensuring Data Quality

Official iD now has a powerful built-in validation panel, which was the result of a collaborative effort among a group of iD developers, including engineers from the Facebook Maps Team. RapiD incorporates this panel and adds a set of additional checks that are specifically relevant to our AI data.

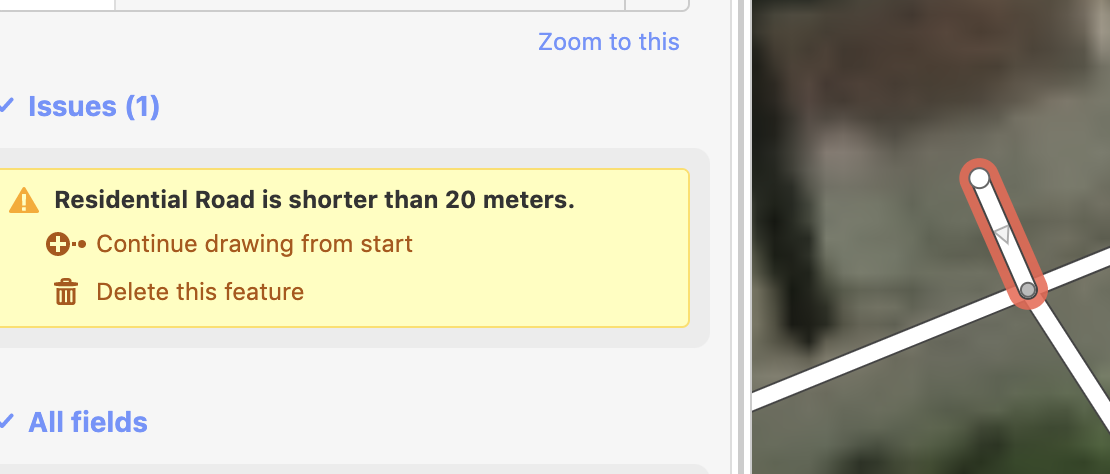
Short road checks look for roads that may need extension or deletion. short_way_checks.png

We have enhanced the disconnected road check to check when a newly-added cluster of roads is disconnected from the already existing road network. This enhancement has also been integrated into the latest release of the primary iD editor.

Isolated_clusters_check.png

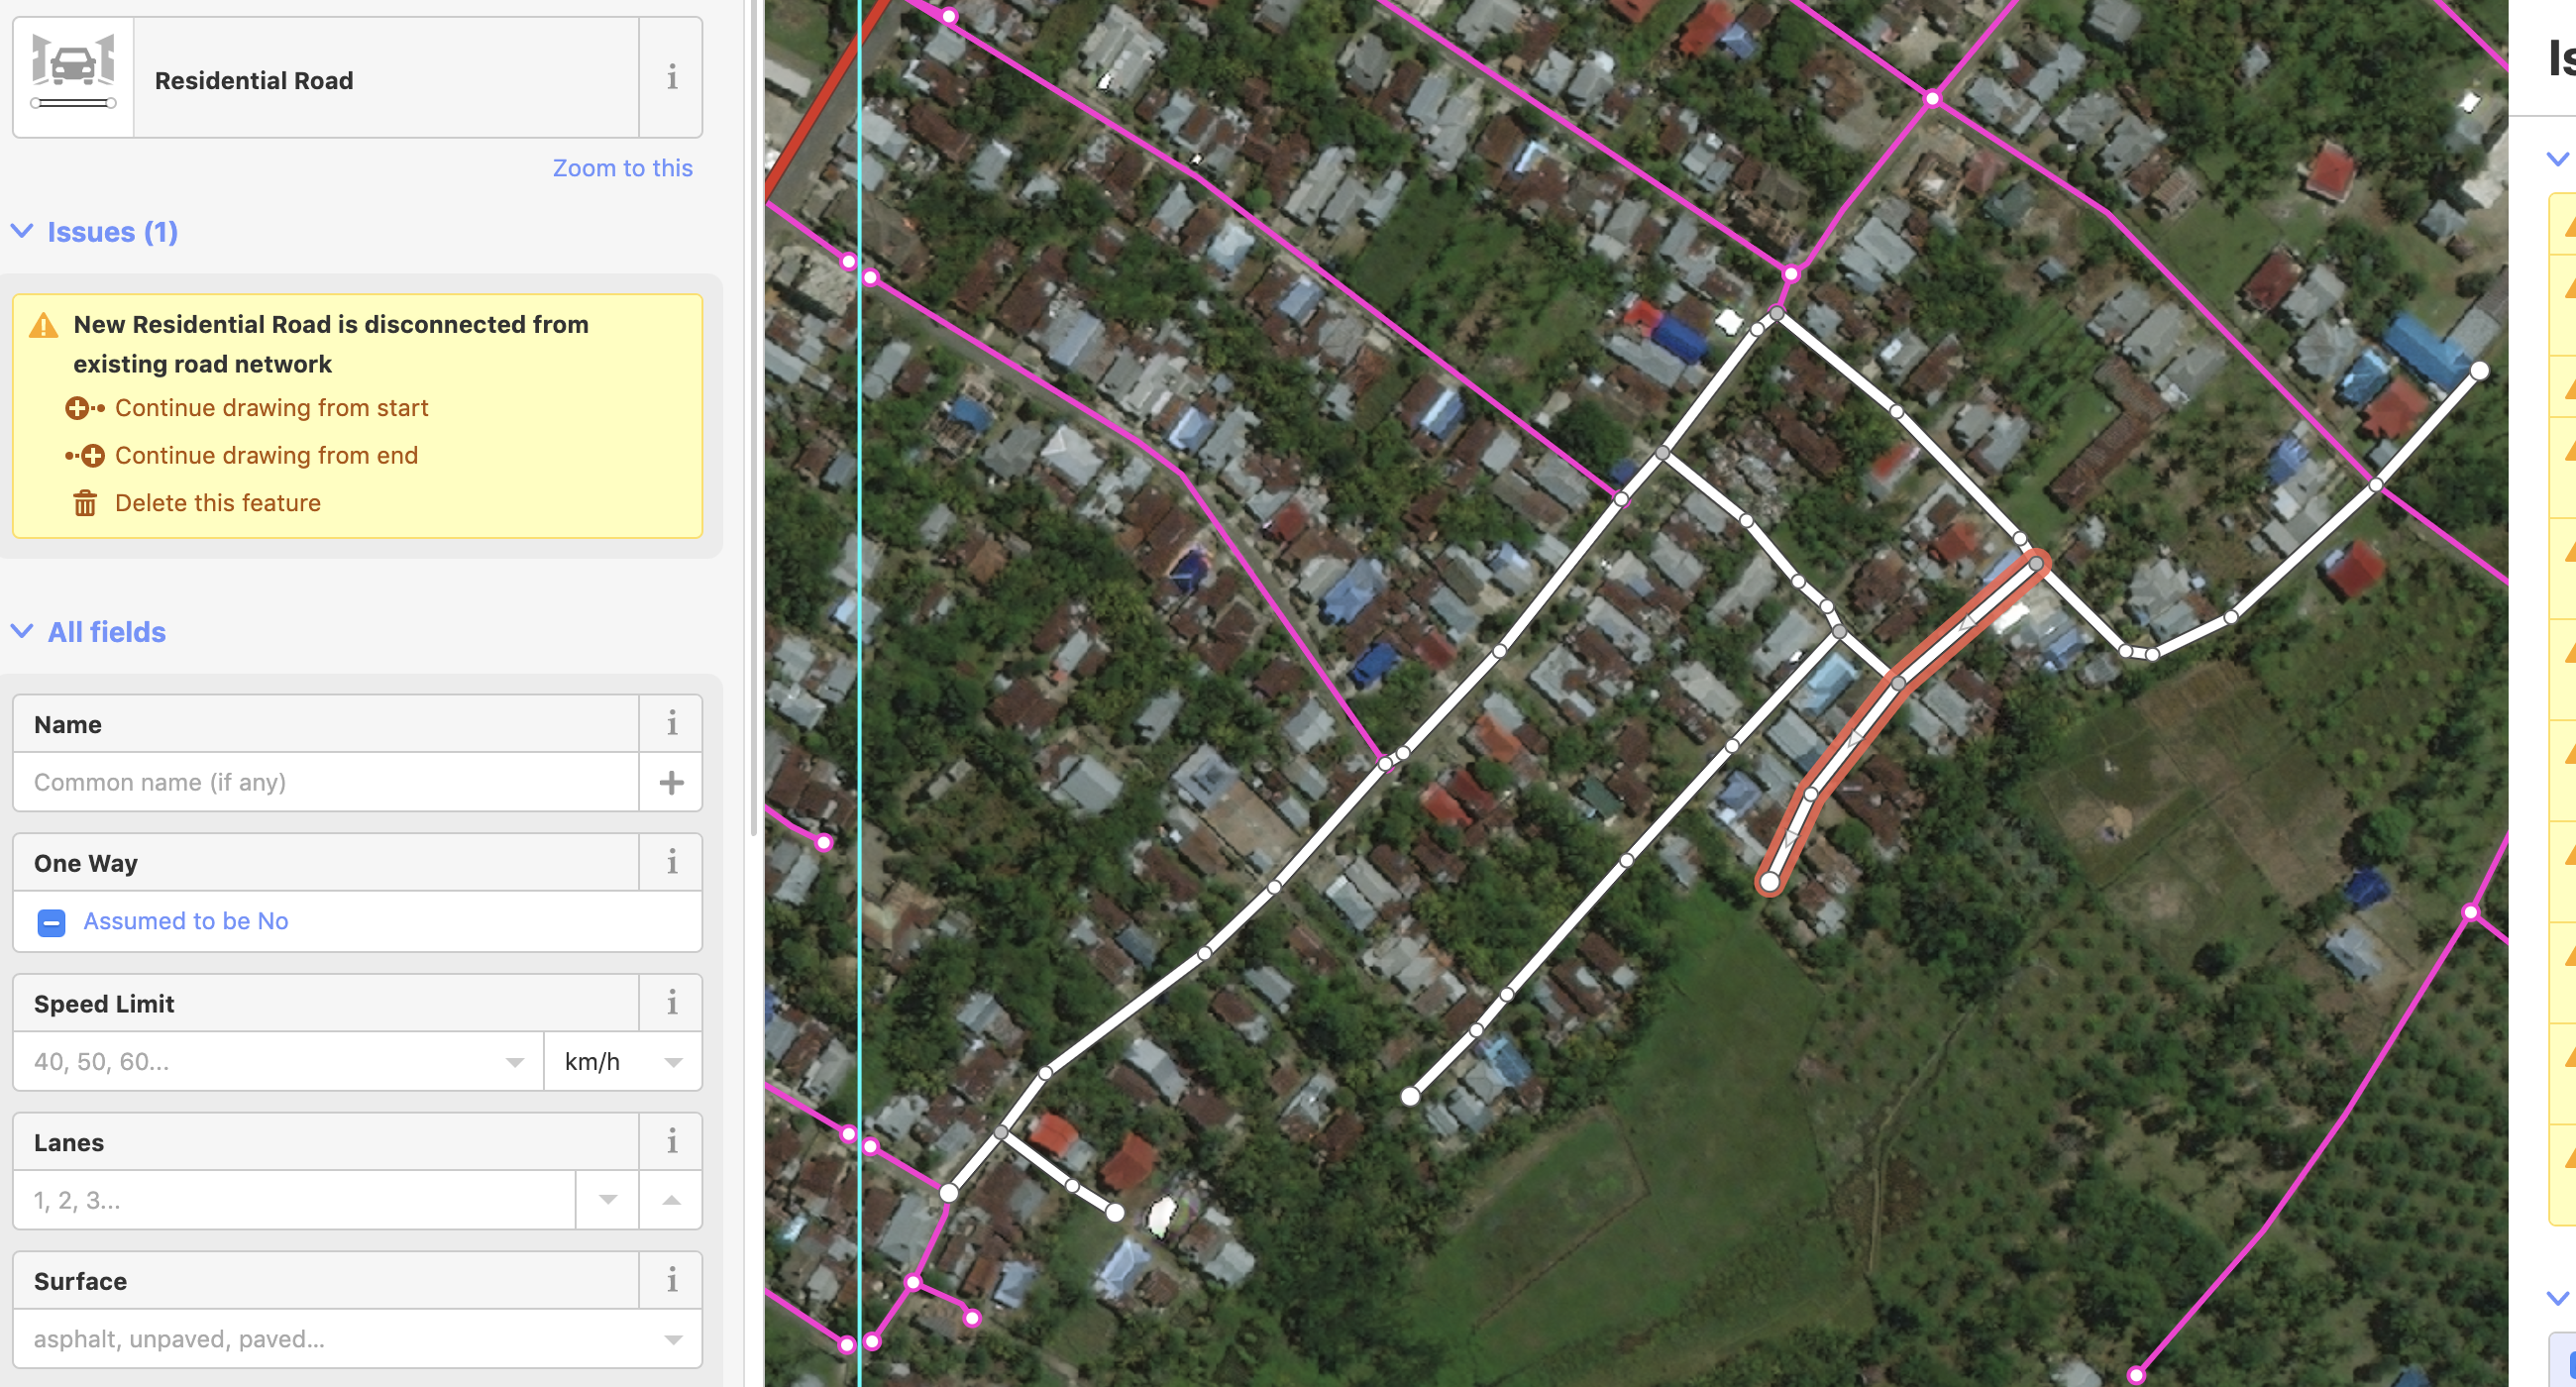
Additionally, we have created a hotkey to let users track where they have edited ways. When toggled on, the segments of a way that have been modified will turn green as well as the entirety of any AI road added. This gives users far more visual clarity on what they have and have not touched while editing than is currently possible in iD. edited_roads_hotkey.gif

Now that you know more about what RapiD does, you might enjoy this comparison video of manual mapping in iD versus using the Map with AI service in RapiD.

Mapping Speed Comparison Using RapiD

Data Integrity and tracking our edits

To further ensure the quality during this process, we will be running a number of tracking tools daily to check on the changesets submitted to OSM through the RapiD editor. This includes the OSMCha flags, KeepRight and OSMOSE. At this beginning stage, all data issues will be reviewed by the Facebook internal mapping team and fixed accordingly. Eventually, we intend to build a project issue tracking system into Tasking Manager 3 to allow a more integrated approach to data validation.

The indicators to track changesets submitted through RapiD are these tags:

  • on each feature: source=digitalglobe, AND;
  • on each changeset: created_by=RapiD (version number)

How to reach the team

  • You can e-mail the team at osm@fb.com
  • Profiles for some of the team members
  • We have created a #mapwithai_feedback slack channel on OSM US. Members of the team will be available to answer questions immediately during these time below.
    • Friday 31st May - 11:30am-12:30pm PST
    • Tuesday 4th June - 9am-10am PST
    • Thursday 7th June - 11am-12pm PST
    • Monday 10th June - 9am-10am PST

We look forward to sharing the feedback and findings of our testing phase. Stay tuned for more!

Position Statement: OSM US Board

Posted by DrishT on 11 October 2015 in English. Last updated on 12 October 2015.

Getting lost in rural Rwanda is kind of disconcerting. My team and I had a general idea of which body of water to follow, but without a proper map, it was hard to know exactly which bend in the river we had just passed. But mapping is why we’re here, after all. We’re filling in this community’s map partly so emergency responders won’t get lost. Unlike us, emergency responders don’t have the time to decipher bends in the river. Someone else won’t do it for this community, so they’re doing it themselves, with a little help from my team and a lot of help from OpenStreetMap.

A year and a half earlier I decided to take a risk. I left my cozy job with Apple to work for the American Red Cross. After having completed Graduate degrees in Nonprofit Management and Emergency Management, it seemed like the right thing to do.

My first week happened to coincide with the onset of the Ebola crises. By my second day on the job I was using OpenStreetMap to make maps for Red Cross disaster responders deploying to West Africa. I got to witness the power of digital volunteers, and saw how the new information they were adding was being used in the field to make real-time decisions. Teamwork and collaboration around mapping unfolded before my eyes. Needless to say I fell in love, and wanted more.

Months later I got my wish when we launched the Missing Maps Project. The goal of the project is to map the most vulnerable places in the world so that NGOs, communities and individuals can use the maps and the data to better respond to crises. The project seeks to literally and figuratively put people and their communities on the map.

Since Missing Maps’s launch in 2014 I have hosted and helped plan, more than 15 mapathons in the US. We’ve been able to expand our reach by coordinating with companies, government departments, universities and community groups around the country to grow interest in mapathons and introduce people to OpenStreetMap.

mapathon Fun part of my job is planning themed mapathons, where I get my co-workers to dress up in costumes like our ugly sweater mapathon last Christmas.

I have also been lucky to have led community mapping trainings in various countries where the American Red Cross is working, specifically Rwanda, Tanzania, South Africa and even my home country where I was born and raised, Zimbabwe. Being able to see a blank space on a map fill up with information that is then used to make programmatic decisions that change lives—it’s nothing short of amazing.

rwanda mapping Mapping with volunteers in rural Rwanda, using field papers and OpenMapKit to collect data.

What I love about OpenStreetMap is that it’s not just about mapping rural communities in Rwanda. It’s about bringing people in the US together to map their own neighborhoods and to take control of the data their communities need to make decisions. I am excited about the prospect to work with the local OSM community because I see great potential for growth through cross sector collaboration. In Washington DC I’ve sat at tables with different partners— from the government and private sector to education and nonprofit—who use OSM and have seen successful outcomes from bringing everyone together. I know we can support each other more on a national level. And that bringing together different stakeholders will make OSM even stronger than it already is.

community discussion Community discussions with various stakeholders including local volunteers from the mapping area, local government, university students and Red Cross staff at training in Harare, Zimbabwe.

So why me?

Community engagement and outreach are my forte. I would like to expand the network of the OSM community to include a more diverse membership that continues to have shared interest in using OSM. Through increased communication and collaboration members will be able to share knowledge and leverage resources that will allow individuals or groups to overcome challenges to achieve their goals. This could be in the form of partnering education institutions with humanitarian organizations where students would benefit from gaining experience, and organizations would have access to talented and trained volunteers during times of disasters. This is just one example but there are many more ways.

Secondly I believe my experiences as a third generation Zimbabwean of Indian decent, in addition to my exposure to cultures from both the eastern and western hemispheres helps me bring a unique perspective. Two years ago I had no idea what OpenStreetMap was and now it’s a big part of my job and has expanded my view of the world in new ways. I’m grateful and want to continue that journey.

What I look forward to.

I have no doubt that this would be a great experience for me. Most of my community mapping experience has been international, however I believe there is a lot we can do right here in the US. We are lucky and don’t face challenges that we would normally see in other countries such as; loss of power, no access to wi-fi, general security and ability to travel easily.

I would use this opportunity to be more connected with the OSM community in the United States. There is a vast amount of talented OSM’ers in the country using open data in different ways and I am excited to learn more and expand my knowledge. As we have seen over the past few years the community is growing very fast. A larger effort is required to organize goals and vision so that we move forward in a more targeted way and achieve better results.

And lastly if the past [State of the Map US] (http://stateofthemap.us/missing-maps/) conference has taught me anything, it’s that the OSM community has a lot of fun together. I absolutely loved the last one in NYC and would enjoy being apart of the team that has the challenge of planning the next SOTM-US and see how we can make it even better.

Thank-you for your time and consideration. You can get more information on voting [here.] (https://openstreetmap.us/2015/09/do-you-want-to-be-on-the-osm-us-board/) It’s not too late to [become a member] (https://openstreetmap.us/join/) so you can have your say and vote.

Feel free to comment below if you have questions or reach me on Twitter.

Location: The West End, George Washington University, Ward 2, Washington, District of Columbia, 20037, United States

Community mapping in Cape Town

Posted by DrishT on 15 September 2015 in English.

by Drishtie Patel, Dan Joseph

Fire sensor project background

Nicely conditioned roads, beautiful beaches, cliffs, scenic bays, promenades and hillside communities is what you think of when you hear Cape Town. However a couple kilometers away from these spectacular sceneries and coastlines is Khayelitsha. A partially informal township reputed to be the largest and fastest growing township in South Africa. It’s a humbling sight to see.

Khayelitsha Khayelitsha, CC BY-SA elyob

If you get the chance to spend some time there you will see the amazing community spirit and warmth in the area despite its well known reputation for being extremely dangerous.

Khayelitsha is home to roughly 400,000 people covering an area of 39 square km made up of old formal areas and majority newer informal areas. Red Cross partners have been working in the area and looked into the major concerns the community is facing. Fires are at the top of the list. Fires regularly occur as a result of indoor stove use, trash burning, faulty wires, and residents trying to keep warm. Rapid, unplanned development results in close construction of homes which increases the chance of fires spreading quickly. Pathways between homes are narrow and often blocked, making evacuations chaotic and dangerous. Residents commonly do not know who to call for fire fighting assistance, and if firefighters are available they have a difficult time finding and responding.

Red Cross partners are piloting a project to solve this issue; a low-cost, meshed network of smart home sensors affixed to each home within the informal settlement. The American Red Cross GIS team recently set out to Khayelitsha to support the community in mapping the area for better program planning and decision making. Here’s our story about the experience.

On the ground in Cape Town

Khayelitsha Navigating the narrow paths between houses, CC-BY American Red Cross

Just a few days before the mapping was to start we were advised not to use smart phones due to new security concerns. We normally use phones to run the OpenMapKit mobile data collection app. Fortunately, we could use GPS devices as they would be much less desirable targets for theft.

Early on a very chilly morning we headed to the Andile Msizi Community Center in Khayelitsha with the South African Red Cross team. We met 34 volunteers and started a 2 day training introducing them to OpenStreetMap and the community mapping process. Volunteers were from the local area and immediately got hooked on the OSM iD editor looking at the satellite imagery of their neighborhoods and pointing out where they live.

At the Community Center the group had insightful discussions, learned how to use printed Field Papers pages for collecting data and practiced using the GPS devices. Breaks for hot coffee and pastries kept energy levels high.

Field mapping

Volunteers Volunteers verifying their position, CC-BY American Red Cross

Our cozy days indoors ended as we headed out to start collecting data. Teams of 4-5 volunteers were escorted by community leaders and Red Cross staff into the section chosen for the day. We equipped our volunteers with Field Papers and Garmin GPS units to collect data and GPX tracks. The area is very dense, has no centralized plan or regular layout, and structures are generally small and non-rectangular.

Remote tracing done ahead of time by digital humanitarians was hugely beneficial, giving us a fairly accurate foundation of data to add to. The tracing was possible thanks to recent, high resolution imagery from Mapgive. Map literacy can be a challenge for volunteers, and the better base map made the community mapping an easier process. The GPS devices were loaded with the Field Paper’s grid and the OpenStreetMap base map to help with navigation.

Garmin Garmin loaded with custom OSM data, CC-BY American Red Cross

After some initial fieldwork we were able to use the GPX tracks from teams walking through the area to check the alignment of our two sources of satellite imagery (Bing and the very recently captured NextView imagery obtained through MapGive). It showed the MapGive imagery to be more accurately geo-referenced so we decided to adjust the OSM data to match the GPX tracks and MapGive imagery. Volunteers had time to re-visit some areas after the alignment of OSM data, but since the map tiles would not refresh quickly enough for new Field Papers we created custom atlas pages with downloaded OSM data styled in QGIS. This worked out great to fill in gaps after the first round of mapping on the ground.

GPX tracks of mapping teams

Field data collection focused on: editing outlines of buildings (combining, dividing, adding, and removing); adding the path network; adding amenities such as places of worship, shops, and taverns; adding features that were impossible to trace from satellite imagery such as electricity transformers, narrow rows of latrines, and water taps; and adding building numbers.

Building address numbers were a challenge to collect. Volunteers had to walk along two or more paths before being able to approach the part of the building with an entrance and see if a number was posted. Numbers were not always visible on the building, and in some areas the government had spray painted numbers on houses in the process of counting them, contradicting the actual house numbers.

We wrapped up the field mapping and then spent two days at the Community Center inputing data into OSM using JOSM editor.

Next steps

The American Red Cross GIS team will create large maps of the different sections to print and share with the communities. The volunteers will continue gathering data, collecting the locations of the fire sensors to then overlay OSM data to analyze the coverage of the project. We will also share knowledge of our work in OSM with other NGOs operating in the area.

We mapped only a small part of the entire Khayelitsha area. We have some dedicated and motivated Red Cross volunteers who want to continue to ground truth OSM data. We need your help to finish the remote tracing to make their work easier. Take a couple of tasks, http://tasks.hotosm.org/project/1182.

Location: Cape Town Ward 90, City of Cape Town, Western Cape, South Africa