OpenStreetMap

Diary Entries in English

Recent diary entries

Welcome to my fifth (and a half) OpenStreetMap NextGen development diary.
Tomorrow, I’m returning home and I’ll be able to resume work at full speed 🔥.

This is a short edition of the development diary.

🐙 This project is open-source and publicly available:
https://github.com/Zaczero/openstreetmap-ng

Intro

For the past 13 days I have been on a journey of finding a new place to rent. Without my home office, I wasn’t able to become productive. The place I’m staying at doesn’t have a good office spot and being on my laptop doesn’t help. However, I am now very motivated to get back to work and push even harder!

May Will Be Big

At the end of May, OpenStreetMap-NG will include necessary functionality to run on a testing server, as well as to invite new contributors into the project. Starting with 6th of May, I won’t have any time-consuming plans for this month so I’ll do my best to wrap everything up. What’s exactly left has been described in Diary #5 Short-Term Development Plan. I have already started to prepare the All-in-One Contributor Guide which will also be finished up (it currently lacks backend/frontend-specific guides). This is going to be the first major milestone of the project!

Project Sponsors 🏅

I was happily surprised to see new faces even during my lower activity period. I will do everything to deliver the promised results. As always, thank you for supporting the project, monetarily, and with staring the project on GitHub!

Currently, the project is sponsored by 13 people!
Five private and four public donors on Liberapay, and four public on GitHub Sponsors.

Disclaimer

This project is not affiliated with the OpenStreetMap Foundation. It’s an independent and community-sponsored initiative.

Posted by ZeLonewolf on 30 April 2024 in English. Last updated on 2 May 2024.

There is a long discussion happening in the United States section of the community forum regarding where to draw the line between the “main” populated place node values, and specifically the place=* values of city and town in New England. I thought it would be useful to do a bit of analysis to see how these values are distributed across the database when compared to population. Through this analysis, I include all tags which have place values of city, town, village, hamlet, and isolated_dwelling. I also only include nodes that have a population tag.

My overpass query for each category looks like this:

[out:csv(::id,place,population;true;"|")][timeout:60];
node[place=city][population];
out;

One of the challenges of analyzing this key is that because it represents order-of-magnitude differences, its distribution is log-normal. In other words, it forms a bell curve provided that the X-axis is drawn logarithmically.

To look at this data logarithmically, I grouped the place nodes logarithmically, in steps of 1, 2, and 5 per 10x jump. When viewing the distribution of place=town, the log-normal shape comes out quite clearly. The number on the X axis represents the upper limit of each bin.

Graph of place=town distribution on a log scale

Now that we’ve assessed that the data is distributed log-normally, the next question we want to be able to as is, for a populated place with a certain population, how are the place values distributed? For this, we look across each logarithmic “bin” and determine the percentage of each place value in use:

Graph of place distribution by percentage

We can assess, for example, that for places with a population between 500 and 1,000 (the bin labeled “1,000”), it’s tagged place=village over 90% of the time. The village blip at 10,000,000 is the result of a data error - a single remote place node being erroneously tagged with a high population in a bin of size n=19. Needless to say, on the far right of this graph, there are fewer and fewer nodes in each bin.

Lastly, we would like to know the mean and standard devation of each place category. However, since this is log normal, we need to compute the mean and standard deviation in the logarithmic domain, and then convert it back. The mean, and plus or minus two standard deviations are computed in the table below:

place= -2σ -1σ μ +1σ +2σ
city 8,341 33,118 131,496 522,118 2,073,119
town 782 2,814 10,124 36,422 131,039
village 13 71 393 2,173 12,011
hamlet 2 8 36 165 763
isolated_dwelling 0 2 6 22 84

Thus, this means that 68% of place=town nodes – one standard deviation – that are tagged with a population tag, have a population= value between 2,814 and 36,422. Taking this out to two standard deviations, 95% of all place=city nodes have a population= tag value between 8,341 and 2,073,119.

Clearly, there is considerable overlap between each category, no doubt because of differences in tagging conventions between places, differences in accounting for population, and differences in place tagging in areas of different population density.

Posted by rtnf on 29 April 2024 in English.

One of the most rewarding aspects of being an OpenStreetMap contributor is the surprise of discovering where your contributions will be displayed next.

“I put that obscure, forgotten place back on the map, and now they’re everywhere!”


Researching toponyms is fun because I have to analyze the daily conversations among the locals and try to triangulate the place name centroid based on this conversations. Bonus point if my centroid triangulation somehow coincides with ancient, forgotten, historical maps.

Traces of Sepatan, Djati, and Rawa Roko can still be found on old historical maps, circa 1900. Locals still use these toponyms right now, despite the government’s refusal to acknowledge their existence in the official addressing system.


It’s ‘forgotten’ in the sense that the local government over here has simplified the toponym system too much. Some toponyms have been upgraded to official administrative region names (and are now embedded in the official addressing system), while the rest have been left behind. People still use these ‘left-behind’ toponyms daily to refer to certain places, even though the government has somewhat ‘discouraged’ their use. (The colonial administration did it better, though. When I consulted the archives and library for old maps, all of these ‘left-behind’ toponyms were actually mapped quite well in the past.)

And this situation has led to mass confusion for people. Government-mandated addresses often don’t reflect reality. People still use all those ‘left-behind’ toponyms in their daily activities, yet they don’t appear on official, government-mandated maps and addressing systems.

That’s one of my personal missions right now: to put all those ‘left-behind’ toponyms back on the maps.

Location: Kp Rawa Roko, Babakan, Bekasi, West Java, Java, 17116, Indonesia
Posted by ivanbranco on 28 April 2024 in English.

[Semi-automated translation of the Italian diary entry]

On OpenStreetMap, a tree can be represented as a natural=tree node.

Leaf type 🌿

leaf_type is the most common tree-related tag in the database, this is because it is easily verifiable and is supported with a quest by StreetComplete. The values are broadleaved and needleleaved. Some argue that palms should not be tagged as broadleaved but with a value of their own, =palm.

Leaf cycle 🍂

This tag describes whether a tree is deciduous or evergreen. Most needleleaved tree species are evergreen, but this is not always the case, so do not infer this value automatically. You can add this value easily if you know the species, or more simply if it is autumn/winter. If not, you can try to see if satellite or street-level imagery taken at those times are available.

Genus and species 🌳

If you are not an expert, there are tools that can help you recognise the genus/species of a plant, such as Pl@ntNet and iNaturalist, both of which also exist as mobile apps. On OpenStreetMap there are many trees with species (or species:wikidata or species:xx) that do not have leaf_type or leaf_cycle. These values are of course identical for each species (and also for many genus) and can therefore be easily deduced. There are two lists on the OSM wiki that contain these values for genus and species.

MapComplete has a dedicated tree theme that can be used to enter the species while SCEE has a dedicated quest (“What is the genus or species of this tree?”).

Monumental trees 🏛️

Monumental trees can be mapped adding denotation=natural_monument. In Italy they are recorded by the Ministry of Agriculture, Food Sovereignty and Forests (Masaf) with annual updates. You can map them by adding ref:masaf, which is a unique code assigned by the ministry.

The Black Poplar of Tronzano Vercellese

In Poland they are recorded by the ‘Generalna Dyrekcja Ochrony Środowiska’ (GDOŚ) (you can find many of them with a query natural=tree+ref:inspire=*), in Serbia many zapis (sacred trees) are mapped with ref:zapis while b-unicycling has recently documented the place_of_worship=sacred_tree tag to map rag trees in Ireland and Scotland.

Rendering 🎨

Trees are rendered on Carto as green circles with a brown dot in their centre, regardless of their attributes. Rendering of Carto trees

The Straßenraumkarte Neukölln renderer shows the trees differently according to leaf_type, circumference and diameter_crown. However, the web map only works for the Berlin district of the same name.

F4 Map and Streets GL (no longer updated) are 3D renderers that use the height tag. F4 Map distinguishes trees by foliage type and also supports some values to differentiate palm trees. Esri also has a 3D map that uses OSM data, and which should support height and also some genus values.

On the IMAGICO.De blog, there is an interesting article that goes into detail on possible renderings to highlight the various attributes.

QA 🛠️

There are more than 20,000 mapped trees, but QA tools are still few. That is why I created this MapRoulette project: Tree Validation.

There are challenges that compare values in the database with the largest values ever recorded in nature, for example trees taller than Hyperion. Other challenges concern uncommon or incorrect values of denotation, species, genus, leaf_cycle or leaf_type.

The hope is that in the future more and more tools will check on tree tagging. For now there is at least one open issue for Name Suggestion Index and one for Osmose/JOSM.

If you want to discuss trees on OSM, you can use the “tree” tag on the OpenStreetMap Community Forum.

Have fun mapping!

Posted by matthewsheffield on 28 April 2024 in English.

I’ve finished (for a second time!) mapping all the paths in my local cemetery. The first time another mapped decided that concrete or gravel ways designed for walking on weren’t “paths” and deleted them all. He also seemed to have strong feelings about people cycling in cemeteries, which is odd as The Greater Metropolitan Cemeteries Trust actually endorse it as a use of their land. As my daughter is buried in the cemetery I feel some ownership of the place, and do love it and Merlynston creek that flows through it. I’m hoping no one vandalises my work again.

Location: Hadfield, Melbourne, City of Merri-bek, Victoria, 3046, Australia

I received a request to update my previous list of people who map every single day. The top 3 places remain the same, with Aurimas Fišeras passing the 10 year mark of non-stop mapping! Congratulations on an amazing accomplishment, and a big thank you to all of these dedicated mappers!

Consecutive Days First Day of Streak User
3672 2014-04-03 Aurimas Fišeras
2810 2014-08-09 vichada
2687 2016-10-22 ika-chan!
2256 2018-02-17 LidaCity
2106 2018-07-17 Algebre gama
1943 2018-06-02 thetornado76
1943 2018-12-27 hendrik-17
1894 2014-06-15 roschitom
1860 2017-04-13 looniverse
1837 2019-04-12 bxl-forever
1828 2019-04-21 JJIglesias
1755 2019-07-03 Sammyhawkrad
1674 2019-09-22 Zrop
1631 2019-11-04 mstock
1629 2018-06-26 phiphou
1583 2018-10-06 fx99
1544 2018-10-29 BCNorwich
1501 2014-06-26 RoadGeek_MD99
1467 2017-11-04 dvdhoven
1450 2018-02-16 alkushi
1392 2019-10-25 marczoutendijk
1346 2017-10-28 piotrS
1336 2020-08-25 NieWnen
1318 2020-09-12 Strubbl
1305 2020-09-25 mindedie
1292 2017-12-11 vincent_95
1291 2020-10-09 Leonius_Bad
1286 2020-10-14 Grass-snake
1259 2020-11-10 SekeRob
1240 2020-11-29 seattlefyi
1211 2015-01-28 lodde1949
1159 2017-02-05 futurumspes
1153 2019-02-10 jmapb
1149 2021-02-28 MJabot
1092 2019-03-21 mmahmud
1070 2016-06-15 mindedie
1064 2018-08-12 ikiya
1063 2017-12-02 下り専門
1055 2019-07-22 Nesim
1031 2021-06-26 vincent_95
1026 2015-09-25 Nesim

SotM Latam 2024 - Belém/Pará - Brasil.

The State of the Map Latam 2024 will take place in the city of Belém, Brazil, from December 6 to 8, 2024 at the Instituto Federal do Pará, this being the sixth edition of the ‘Latin American OpenStreetMap Conference’ and aiming to promote the use of OpenStreetMap (OSM), and the integration of OSM mappers, developers, open data communities, free and open source software communities, students, researchers, geoinformation professionals, non-governmental organizations, companies and public institutions.

SotM Latam 2024 After the voting period for choosing the SotM Latam 2024 logo has concluded, I am pleased to announce that the chosen option is 1.

You can see the results and voting details in the document shared above: https://docs.google.com/document/d/15Kbotyc6UCcWQ2K7apPOnfqXSSDFfvlDQtZxM_Nkag4/edit

Website: http://2024.osmlatam.org

https://wiki.openstreetmap.org/wiki/ES:LatAm/Eventos/State_of_the_Map_Latam_2024

You can see the voting results and details in the previously shared document: https://lnkd.in/dQcDDFCv

an organization of UMBRAOSM Union of Brazilian mappers from Openstreetmap, Latam Community and Foss4g

SotM Latam 2024 organizing committee

Contact: state@osmlatam.org

http://www.umbraosm.com.br

Location: Marco, Belém, Região Geográfica Imediata de Belém, Região Geográfica Intermediária de Belém, Pará, North Region, Brazil

The eTrex 20x

Years ago when searching for a viewpoint from an old photo where I wanted to do rail photography I managed to locate the exact cliffside overlook and discovered a somewhat hidden gem of trail network in the process.

Though there is an official dirt road in the canyon below and a few desire paths offshooting from it the hills above remained relatively unmapped not showing up in the otherwise void of an area.

With the understatement of the local forecast for the afternoon/evening I packed my beloved eTrex 20x in the camera bag along with my trusty Nikon D700 planning to take in some of the views while there in between tracing runs expecting no more than some cloudiness and a light sprinkling.

The Overlook

I had originally planned to do some averaging as well to mark down 3 of my favorite spots on the cliff to photograph the scenery below but just as I reached the overlook the light rain that had accompanied me on most of my journey up started to thicken and become slanted. Just as I positioned myself on the side of the ledge for my first point reading spot the wind had picked up considerably to near constant 70kph gusts. The eTrex wobbled fiercely atop the perching rock and I had to scrap my plans of more photos just to hold it still for fear it may fall to it’s death below as my other hand clinged to the rockface hoping to avoid a similar fate.

After 5 minutes to allow a good average I quickly hit save and climbed back up to grab my gear bag and make my way back down the path for the second tracing run in the opposite direction to help iron out anomalies when mapping from the trace. As I set off the steadily increasing rainfall now started to turn to almost sideways hail from every direction as the many rockfaces perturbed the wind. Though hectic as it may seem the eTrex managed to maintain it’s nice 8 foot accuracy throughout most of the trip and likewise I was similarly high spirits.

In an almost serene state of mind while walking the trails my attention drew to the contrast between the dramatic weather and environment and the life which springs forth from otherwise dead plains because of it. Many cacti once shriveled from the dry winter were now stuffed with water, their beautiful flowers blooming brightly pink which would soon bear fruit. The normally tan plains dead with brush now teeming with fluorescent wildflowers of all colors in every direction. In that moment I remembered who I was when escaping here 11 years ago, hurt and tired of the chaos and sterility of the urban design seeking to hide from the world and in the process discovering a new one all to myself.

All in a day's mapping

It’s these things the fuel my passion for exploring and desire to document what’s around me, the eTrex always at my side as a faithful companion for so long now. The amount of memories and many long adventure it holds being priceless to me.

Posted by FargoColdYa on 26 April 2024 in English.

Summary: What if AI creates the Changeset Comments? We could send locations, tag types, and quantities to get an output. AI would have to be run locally with small models for cost and be validated by the user.

Problem 1: Time I assume that 1,000 users create 2 changes in 1 day. We assume that each change set takes 3.5 seconds. 1000 users *2 changes * 3.5 seconds per change = 7000 seconds. OSM Users spend about 1.9 hours per day.

Problem 2: Skill Outsourcing Users should spend time on the things AI can’t do.

Problem 3: Server Side Peer Review We have human generated changeset comments. We could create AI generated changeset comments. We could ask the AI, “are these 2 changeset comments so different that it looks malicious”?

General AI Inputs: 1. Location: Where did the user map? 2. Feature Types: What tags did the user use?

AI Prompt: “You are an AI system. A user made edits in OpenStreetMap, a collaborative mapping project. They mapped locations[Mappleville, MN, USA; Bobville, MN, USA] with tags[50xSidewalks, 20xMarkedCrossings, & 10xReligous Areas]. You will create a changeset comment that concisely tells human reviewers what this changeset was about in 3 sentences or less. Exact numbers are not important. Changesets describe changes, so don’t request anything. Don’t mention anything that is common across all changesets.”

AI Response (https://www.meta.ai/): “Added sidewalks, marked crossings, and religious areas in Mappleville and Bobville, MN. Improved pedestrian and accessibility mapping. Enhanced local community information.”

Specific AI Inputs for Locations: 1. Cities[1 to 5], States[1 to 5], Countries[1 to 5]. 2. Is this a place with unclear boundaries? (What if somebody maps the ocean) 3. What is the size of the bounding box for this edit in KM?

Specific AI Inputs for Feature Types: Tags[1 to 6] & corresponding Quantities

Algorithms: 1. Sort the following tags by how frequently each was used in descending order and a limit of 5. 2. For each city, how often was each tag used? Create a table unless the table is huge.

Complexities of the process: 1. Disputed Boundaries: This was the changeset that changed the boarder. 2. Large Edits: Do not run this edit over changesets larger than 500 edits. 3. Malicious Inputs: Somebody named a building tag after a war crime. The AI received that as an input. What does the AI say? 4. Resource Allocation: Developer Time could be better spent doing something else. 5. Irregular Edits: I will use every tag in OSM only once. I will map an area the size of a continent.

Complexities of AI in general: 1. Uncommon Languages: Are these things only good at the 5 biggest languages? 2. Edit Safety: The user mapped religious areas in 2 different nations that share a disputed boarder and are in a war. 3. Money: Laptops with TPU’s are not common in 2024 (but will be in 2030). Mobile Editors with TPU’s are not common in 2024 (but will be on high end phones in 2030). Running AI costs money. Who will pay for it?

Solutions: 1. AI runs locally on a TPU. 2. If you use the outputs of an AI for changeset comments, you are responsible for safety.

Disclaimers: 1. I don’t work in AI. 2. I describe what I don’t have the resources to build. 3. I assume that developer resources should focus on high priority tasks.

Expected Development Difficulty: 1. Web to TPU is hard: Graphics have standard libraries (OpenGL). AI TPU’s are not common and don’t have standard libraries. 2. This can create giant tables if you are not careful.

The benefits of manual changesets: 1. Spam is harder to create in bulk. 2. Self reflection is encouraged. 3. Individuality is good to see. 4. Changesets are the alternative to the Change Approval Board (CAB meetings). It is supposed to take effort.

TLDR: OpenStreetMap (OSM) edits could be aided with AI-generated changeset comments, potentially saving users 1.9 hours daily. AI could analyze edit locations and feature types to generate concise comments, freeing users to focus on tasks that require human expertise. However, implementing AI-generated comments requires addressing complexities like disputed boundaries, TPU libraries, and malicious inputs.

Location: Rose Creek, Fargo, Cass County, North Dakota, United States

There are some object categories in OSM whose exact classification is often a matter of contention and edit wars. Main highways are one of the most prominent examples. There was a small edit war in Poland which resulted in no less than 4 blocks, but I did not let that crisis go to waste:

Behold road-watcher, a quick Python project that regurarly queries Overpass API for highway=secondary and above within a specified boundary and then detects any classification changes, sending them to a Discord channel (though it’s trivial to substitute it with another means of notification).

obraz.png

The SMCoSE YouthMappers Chapter, renowned as one of Tanzania’s largest mapping communities, hosted a transformative mapathon on April 14, 2024, at the esteemed Sokoine University of Agriculture. This event marked a pivotal moment of collaboration, extending invitations to other YouthMappers chapters in Morogoro, thus amplifying the inclusivity and impact of the initiative. Central to the mapathon’s objective was the concerted effort to contribute to Project #15530 within the HOT Tasking Manager, focusing on mapping cities across the Eastern and Southern Africa Region. By leveraging the power of open data, participants aimed to craft detailed base maps crucial for diverse applications, ranging from urban planning to efficient disaster response strategies.

Amidst an atmosphere described as “fantastic,” the event witnessed a remarkable accomplishment, the successful mapping of approximately 25,000 buildings. This feat not only underscores the collective dedication of the participants but also showcases the tangible outcomes of community-driven endeavors. Moreover, the mapathon served as a platform for new mappers to acquaint themselves with essential mapping tools such as ID Editors and JOSM, empowering them to contribute meaningfully to the OpenStreetMap ecosystem.

Special recognition is duly owed to the Open Mapping Hub Eastern and Southern Africa (OMHESA) for their unwavering support, notably through the prestigious Spatial People Award. This acknowledgment not only highlights the significance of collaborative partnerships but also accentuates the pivotal role of organizations in facilitating impactful mapathons and community initiatives. In essence, the event epitomized the ethos of collaboration, learning, and contribution inherent within the mapping community, further advancing the cause of open data dissemination and spatial awareness in the region.

In conclusion, the SMCoSE YouthMappers Chapter’s mapathon stands as a testament to the transformative potential of collective action in harnessing the power of mapping for societal benefit. It exemplifies how collaborative efforts can foster tangible change, driving forward the agenda of open data accessibility and spatial literacy within Tanzania and beyond. “We don’t just build maps, we build Mappers”

Location: Mazimbu Darajani, Morogoro Municipal, Morogoro Region, Coastal Zone, 67000, Tanzania

Theatro da Paz, Belém/Pará - Brasil

O Theatro da Paz foi fundado em 15 de fevereiro de 1878, durante o período áureo do Ciclo da Borracha, quando ocorreu um grande crescimento econômico na região amazônica. Belém foi considerada “A Capital da Borracha”. Mas, apesar desse progresso a cidade ainda não possuía um teatro de grande porte, capaz de receber espetáculos do gênero lírico. https://www.theatrodapaz.com.br/

Credito da Foto; Wikipedia, https://pt.wikipedia.org/wiki/Wikip%C3%A9dia:Wiki_Loves_Par%C3%A1#/media/Ficheiro:Teatro_da_Paz_3.jpg Theatro da Paz, Belém/Pará - Brasil

Mais um ponto turístico da cidade de Belém atualizada na plataforma OpenStreetMap https://www.openstreetmap.org/changeset/150449820 através do projeto #MapeaiaBelem, https://projetomapeiabelem.my.canva.site/home que tem como objetivo disponibilizar dados atualizado para todos a comunidade local e também para aqueles que estarão presente aos grandes eventos que acontecerá entre 2024 e 2025, #SOTMLATAM #FOSS4G #COP30 sem contar que esses dados poderá ser utilizado por todos através de APPs como OsmAnd entre outros apps.

2024, SotM_Latam2024, FOSS4G 2024 , Belém, Cop30Belém

Projeto MapeaiaBelem,

Site do Projeto Mapeia Belém. https://projetomapeiabelem.my.canva.site/home Objeto mapeado no Openstreetmap, https://www.openstreetmap.org/changeset/150449820

esse é mas um projeto da UMBRAOSM - União dos Mapeadores Brasileiros do Openstreetmap

site: www.umbraosm.com.br

Instagram: https://www.instagram.com/umbraosmbrasil/

E-mail: contato@umbraosm.com.br

Location: Campina, Belém, Região Geográfica Imediata de Belém, Região Geográfica Intermediária de Belém, Pará, North Region, Brazil

I am currently on a visit to Ireland 🇮🇪 and a lack of proper office space makes it difficult to stay productive. I will try to prepare something cool to show off this week. Sorry for keeping you waiting!

🍟

Location: Murphystown, Leopardstown Rise, Glencullen Electoral Division, Sandyford, Dún Laoghaire-Rathdown, County Dublin, Leinster, D18 CV48, Ireland
Posted by mpulve on 22 April 2024 in English. Last updated on 25 April 2024.

Why is OpenStreetMap ID not updated like OpenStreetMap ArcGIS? These are two different datasets that need to be linked/updated! Is ArcGIS taking over for OpenStreetMap and requiring a fee? ArcGIS needs to update OpenStreetMap ID if they participate! OpenStreetMap ArcGIS has not updated dataset in months! Please help with coordinating these two data set updates! Otherwise this in-browser edition will soon be obsolete! Use ArcGIS to compare your area with the link listed: ArcGIS OSM Are there any differences? Can anyone explain why? On the ArcGIS OSM there are more buildings that they imported from datasets. They should have updated the OSM ID data sets to match their information. Now there is a ArcGIS OSM version 2 that appears to be replacing ID OSM… ESRI

Location: Florence, Pinal County, Arizona, 85132, United States

Introduction

Car in action with Insta360 ONE

In this post, I will try to explain my process how to get best out of Insta360 ONE RS 1-inch camera and successfully upload images to Mapillary. It started out of my frustration of dealing with this camera and Mapillary and I hope you will not have to go through what I have been🙂. I will be focusing here more on software side (how to deal with data) rather than on hardware side (how to set up rig for image capture).

Let me first start with disclaimer that this is not easiest camera to work with Mapillary (hence this guide) and that not even Mapillary is recommending it. It definitively captures better images than GoPro 360, but everything with GoPro is more smooth over whole process, so be aware of this. Camera needs to record in video mode and it relies on additional GPS dongle you have to buy.

This guide assumes familiarity with Python and Linux. Most steps are optional, and you can treat everything as pure recommendation, and while you can always ping me to help you, beware that some technical knowledge (and determination🙂) is needed if you want to extract highest quality from this camera.

Capturing street view

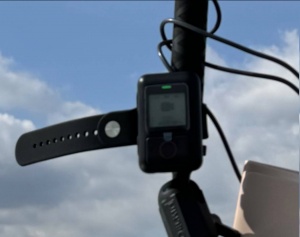
First, you will need another hardware - “GPS Action Remote” with this. In theory, you don’t need it, as you can record with phone (or some other device), but in practice - you just turn on this remote and it works. With phone, you need to have Insta app turned on all the time, worry about display, whether app will get killed by battery optimizations, GPS reception inside car…. I decided to keep my sanity and use this little gadget. It will record GPS (poorly). Connect them and pair them and you can control camera through this remote. Once it show green, it means it is connected to camera and it acquired GPS signal.

GPS Action Remote in action

Mapillary is suggesting to capture images in timelapse mode. If you do this, you will not get any GPS data (that is - you will get first coordinate and that lat/long will be on all images, so unusable). With this camera, you have to record in video mode. This will result in larger files, more drained battery and prolonged post-processing, but hey - at least it will work. You can expect 1h 10 min of recording if you fully top up battery.

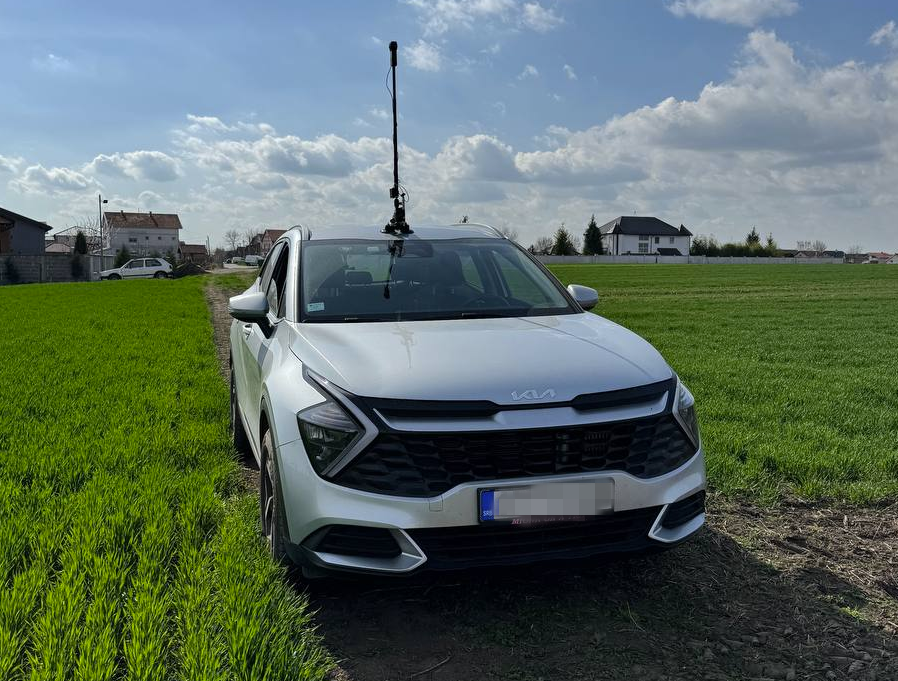
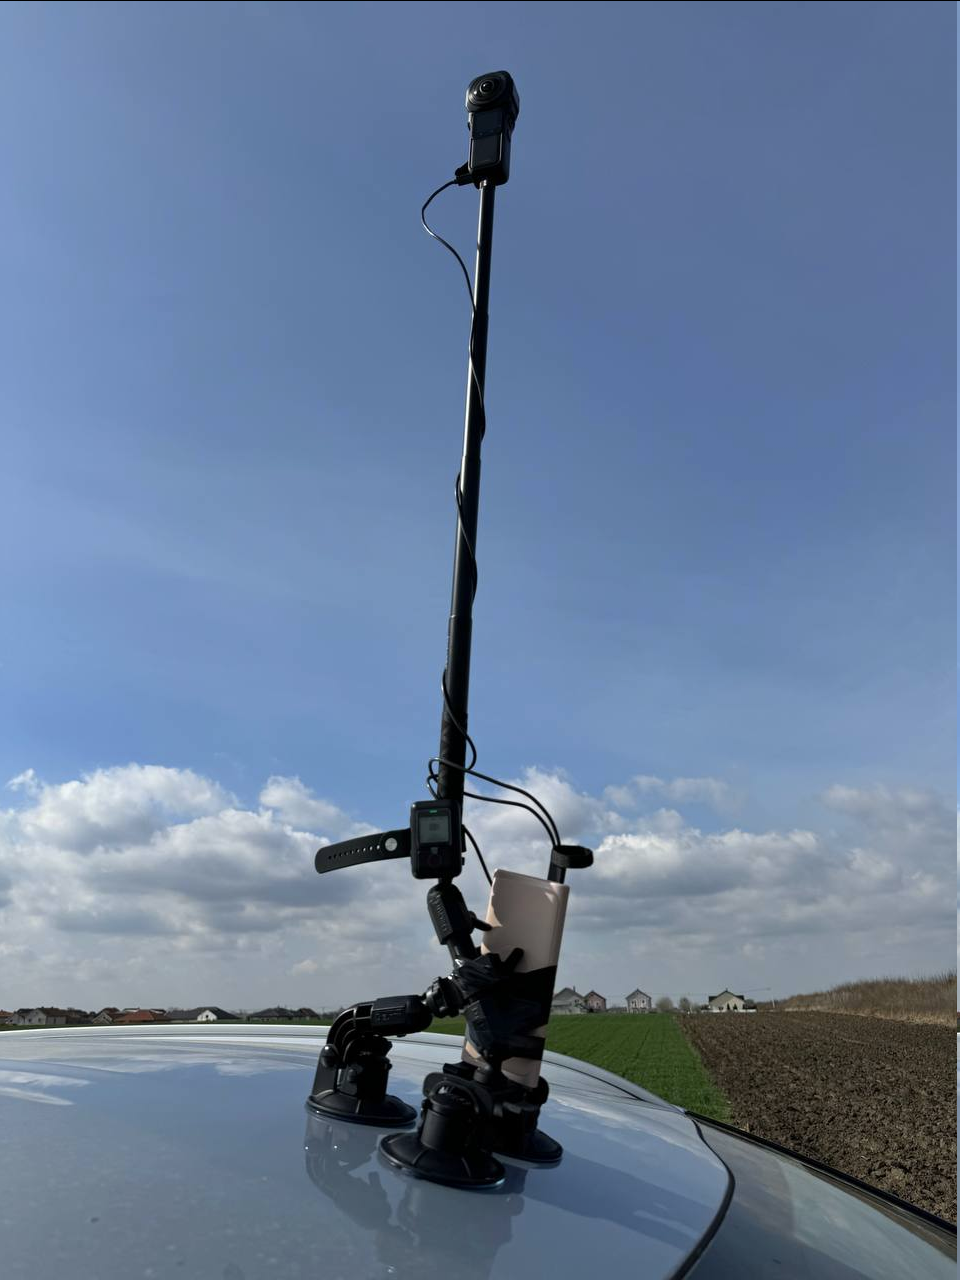
If you are using it outside of car, you can strap both GPS remote and additional battery altogether (watch for hot days and direct exposure of battery to the sun!), but I recommend to go out every 10-20 minutes and check if tripod is holding good. If you are like me and you want to be anonymous and don’t like to be captured by camera, every time you go out, do stop and start video recording again. If you just have one large video, it will be harder to remove yourself (but not impossible), so consider doing this. If you don’t care if your head is in video, then no need for this. This is example how our setup looked like:

Insta 360 in action

If you do not want to do video splitting, you will have to keep your video under 7-8 minutes! If you go over this time, you will have to cut them in post-processing as Mapillary cannot ingest video larger than 8 minutes.

Getting video and track

Once you go home, you will end up with .insv files. Download and open Insta360 Studio application. Import this .insv file. You can adjust quality of image if you want. I usually cut beginning and end of video to only parts where I am driving. If I went outside of car and were checking tripod, I also cut those parts (you cannot cut parts of video, but you can export same video multiple times with different start/end cut times). Once satisfied with cutting, export video. Important thing here is to check “Export GPX track”.

If you don’t want to deal with Linux and cutting video/gpx later, this is your time to cut video into 5-6 minutes segments. Anything larger than this increases probability that Mapillary processing will fail (anything above 8 minutes is impossible to be processed).

At the end of the process, you should end with one .mp4 video file and one .gpx track file. Let’s call them input.mp4 and input.gpx.

Fixing GPX track (optional)

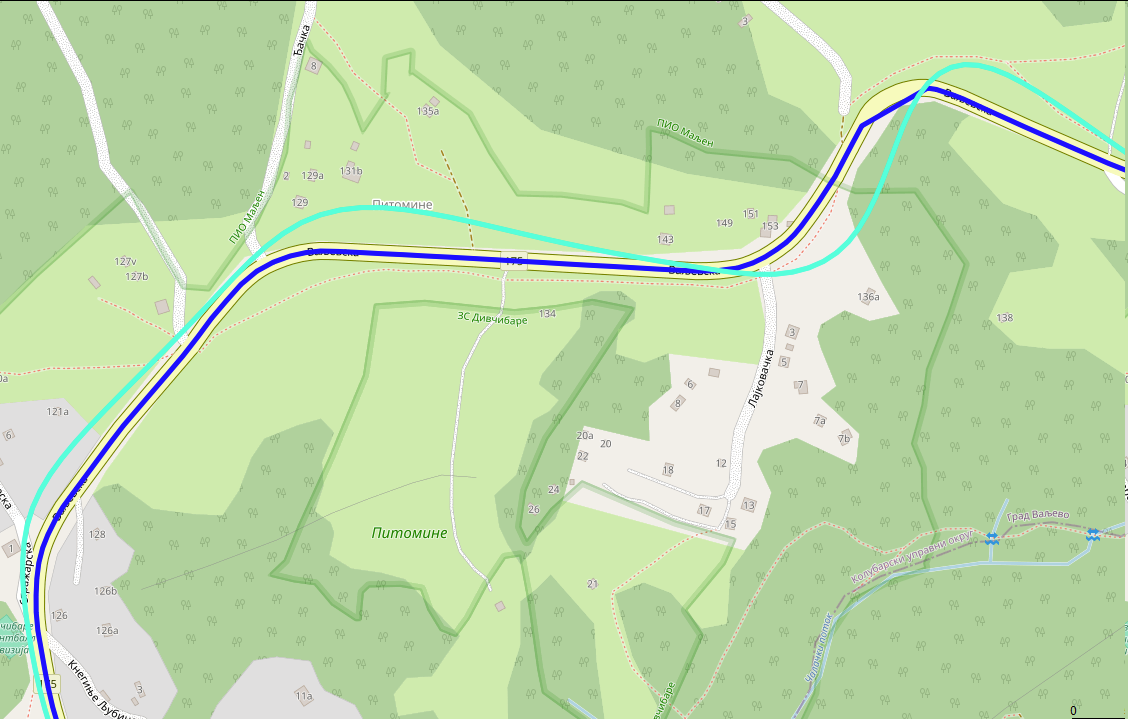
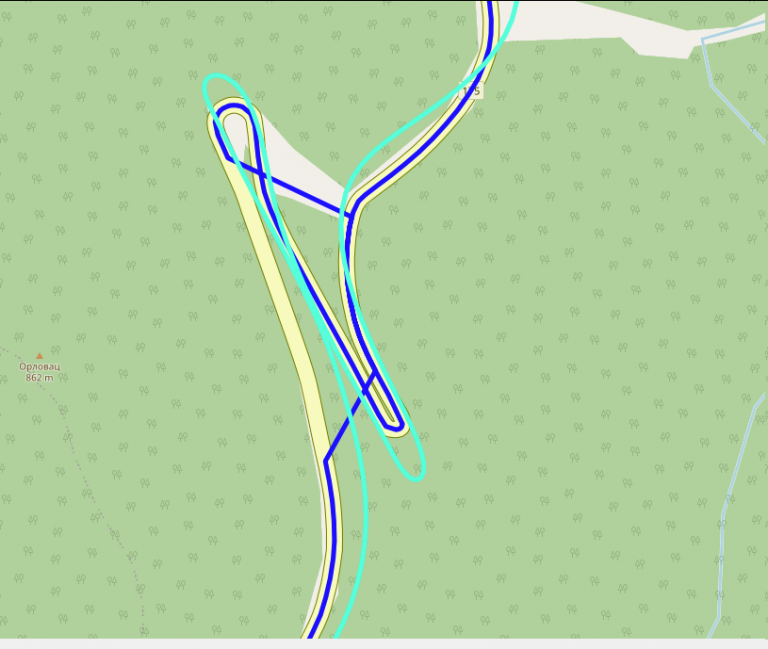
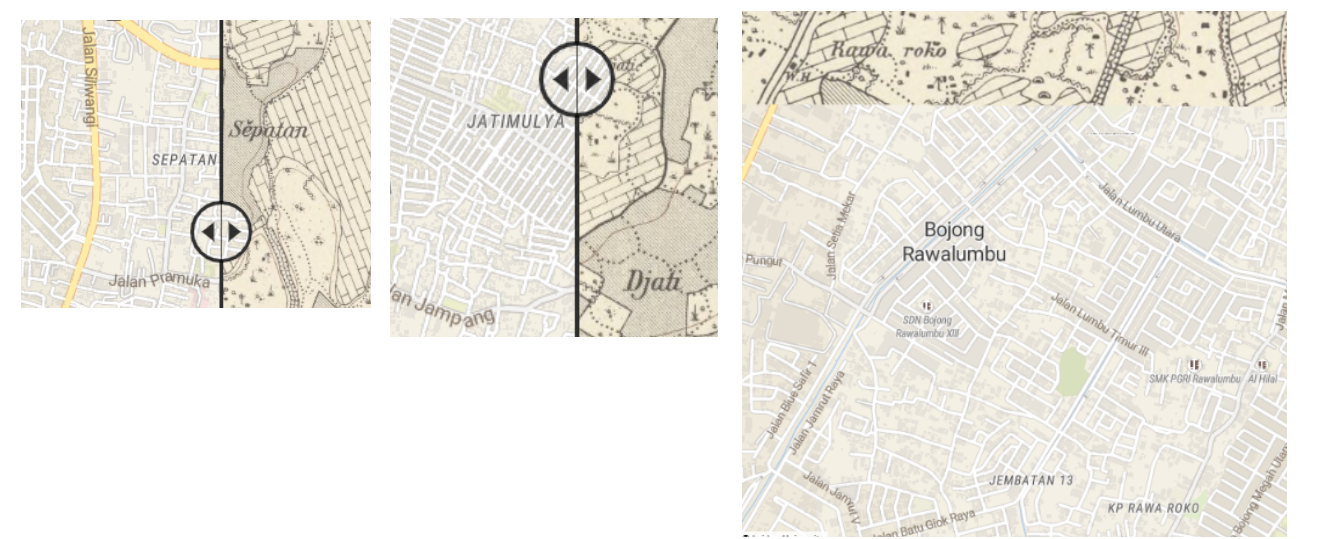
GPX that is recorded with this “Action Remote” dongle is crime against all scientist, engineers, mechanics and everyone who worked hard to give us ability to know where we are using GPS. For this part, you will need to run Python program. If you can live with poor GPS, no need to fix anything, but I just couldn’t. Here is how it looks before (turquoise color) and after (blue color) processing:

And, no, it is not error in OSM geometry

What I did is I used Geoapify platform to do map matching of GPX for me. This is process where you snap GPX trace to closest road. It is really hard problem and I found that Geoapify do very good job converting this Insta360 mess of GPX and their free pricing is more than enough (not affiliated with them, just found them good and easy to work with). First go to their website, sign in and obtain API key (click “New Project”, type any name and on next dialog, just remember generated API key). Here is simple Python script that will take your input.gpx, send it to Geoapify for map matching and then update original .gpx to have new points (while keeping all other attributes like time the same):

import xml.etree.ElementTree as ET
import json
import requests

ET.register_namespace('', 'http://www.topografix.com/GPX/1/1')
ns = {'': 'http://www.topografix.com/GPX/1/1'}

def gpx_to_json(input_filename):
    converted_gpx = {'mode': 'drive', 'waypoints': []}
    tree = ET.parse(input_filename)
    root = tree.getroot()
    trksegs = root.findall('.//trkseg', ns)[0]
    for trkseg in trksegs:
        converted_gpx['waypoints'].append({
            'timestamp': trkseg.find('time', ns).text,
            'location': [float(trkseg.attrib['lon']), float(trkseg.attrib['lat'])]
        })
    return converted_gpx

def do_mapmatching(input_json):
    url = "https://api.geoapify.com/v1/mapmatching?apiKey=<YOUR_APIKEY>"
    headers = {"Content-Type": "application/json"}
    resp = requests.post(url, headers=headers, data=json.dumps(input_json))
    if resp.status_code != 200:
        raise resp
    return resp.json()

def adopt_gpx(input_gpx_filename, mapmatched_json, output_gpx_filename):
    # Load original GPX and segments
    tree = ET.parse(input_gpx_filename)
    root = tree.getroot()
    trksegs = root.findall('.//trkseg', ns)[0]

    # Load mapmatched segments
    waypoints = mapmatched_json['features'][0]['properties']['waypoints']

    assert len(waypoints) == len(trksegs)

    # Change location in original gpx and save it
    for waypoint, trkseg, i in zip(waypoints, trksegs, range(len(waypoints))):
        assert i == waypoint['original_index']
        trkseg.attrib['lon'] = str(waypoint['location'][0])
        trkseg.attrib['lat'] = str(waypoint['location'][1])
    tree.write(output_gpx_filename, default_namespace="")

if __name__ == '__main__':
    input_gpx_filename = 'input.gpx'
    input_gpx_as_json = gpx_to_json(input_gpx_filename)
    mapmatched_json = do_mapmatching(input_gpx_as_json)
    adopt_gpx(input_gpx_filename, mapmatched_json, 'output.gpx')

Save this code as “mapmatching.py”, change “YOUR_APIKEY” to value obtained from Geoapify, run it with python3 mapmatching.py with input.gpx in same directory. At the end of it, you should get output.gpx. Open this file in GPX editor of your choice and manually inspect it. Move any bogus points (it can happen, especially with hairpin roads) and save it - you can now use this .gpx instead of old one. I am using GpsPrune software (available for Linux too) to move points. Here is (rare) example where mapmatching can go wrong:

Splitting videos (optional)

If you ended with videos larges than 8 minutes, this is your time to cut them. I am using ffmpeg and exiftool command from Linux. This is command that will take input.mp4 and split it into out000.mp4, out001.mp4 … files, each up to 5 minutes in length. After that, I am using exiftool to bring back metadata from original video (just so it is nicer to play it in 360 mode in VLC, but I think it is not required for Mapillary):

ffmpeg -i input.mp4 -c copy -strict experimental -map 0:0 -segment_time 00:05:00 -f segment -reset_timestamps 1 out%03d.mp4
exiftool -api LargeFileSupport=1 -tagsFromFile input.mp4 -all:all out000.mp4 # repeat for other out*.mp4 files

Unfortunately, you will have to split .gpx manually (I could create Python script for this too if someone wants, but it was easier for me to just split it in text editor). That is - open .gpx in any text editor, observe time of first point, add 5 minutes to that value and remove all points that happened after exactly fifth minute. If you do this correctly and if you had video of 14 minutes and you cut it in 6 minute segments, you should end up with 3 video - 6 minutes, 6 minutes and 2 minutes as well as 3 .gpx traces - 6 minutes, another one with middle 6 minutes and another one with final 2 minutes. Do rename .mp4 and .gpx to have same names!

You are now ready to upload all these video using Mapillary Desktop Uploader. As long as names of .mp4 and .gpx are the same, you can just drag .mp4 file into Desktop Uploader app and it will show you trace and it will let you upload to Mapillary.

Producing images (optional)

In general, you don’t need this step. This is step if you want to convert video to bunch of images. Some of the reason you might want images:

  • You don’t like how Mapillary is handling videos (street view images too close to each other), or
  • you ended up with large videos that you cannot/don’t know how to split, or
  • you have part of video that you don’t want in Mapillary at all, and you don’t want to split it in Insta Studio app all the time
  • you don’t want to backup large videos, you would rather have images
  • you have poor internet connection to upload those giant video files

In these cases, you can try to generate bunch of images from your videos and upload these. For this, mapillary_tools can help you, but it is not easy to get proper arguments. What I found that works for me is this set of options:

mkdir tmp/
mapillary_tools video_process ./out000.mp4 ./tmp/ --geotag_source "gpx" --geotag_source_path ./out000.gpx --video_sample_distance -1 --video_sample_interval 1 --interpolation_use_gpx_start_time --overwrite_all_EXIF_tags --interpolate_directions

Conclusion

I hope this guide could help you with this camera, if you plan to use it for street view. Feel free to ping me if you need help in any of these steps or if you find that something is missing, or that Mapillary made some things easier in the meantime! Big thanks to friends BrackoNe and borovac who borrowed me this camera and who took these pictures (and whose car this is🙂).

We created a F-Droid repository for all Agroecology Map applications.

F-Droid is an open source app store and software repository for Android.

Agroecology Map is a Free Software, based on OpenStreetMap, citizen science platform that aims to assist in mapping and exchanging experiences in Agroecology.

  • How to add the Agroecology Map F-Droid repository?
  1. Settings
  2. Repositories
  3. Add (+) Repository (https://fdroid.agroecologymap.org/repo/)
  4. Scan QR Code or Enter repository URL manually

Step-by-step https://youtube.com/shorts/4Cw3jPzmS2I?si=zYxrgR1fHMfHEDq7