OpenStreetMap

Alan's Diary

Recent diary entries

Should you rank all the candidates in the OSMF election?

Posted by Alan on 8 December 2019 in English. Last updated on 9 December 2019.

TL;DR: The answer is yes. You don’t have to rank all the candidates, but there’s no reason not to.

The OpenStreetMap Foundation (OSMF) is currently holding an election for four seats on their Board of Directors. This is the governing body for the global OpenStreetMap project, and ideally the Board will represent all the diverse perspectives and communities within the overall OpenStreetMap movement. Thankfully, the OSMF board uses the Single Transferable Vote (STV) method for its elections (also known as multi-winner Ranked Choice Voting), which is perhaps the most robust and flexible form of Proportional Representation, giving the voting public the chance to elect representatives that fairly reflect the diversity of their views, without requiring candidates to form political parties or requiring that the voting public be divided up into artificial geographic regions. I previously wrote a post explaining the benefits of STV for OSM elections here.

As someone who has administered several STV elections in the past (as the elections observer for the OSM-US board and as a co-founder of FairVote Washington) a lot of people ask me for advice about how to fill out their ballot. Not about who to vote for, but how to fill out their rankings so that the candidates they like have the best chance of winning. Specifically, they most often ask whether they should fill out all the rankings, or leave some candidates unranked. Imagine that there are 12 candidates running, and you like six of them and dislike the other six. Should you rank your top six in order and leave your other preferences blank? Or should you keep going and rank your disliked candidates from 7 down to 12, your absolute most disliked candidate?

The great thing about Ranked Choice Voting (especially in a multi-winner form like STV) is that there is practically no reason to ever vote strategically. You can sincerely rank all the candidates in order of preference, from your most preferred all the way down to your least preferred, and be confident that none of your rankings will harm the chances of your favorite candidates to win. Simply put: in an STV election you can and should rank all the candidates according to how much you like or dislike them.

I have heard several people say that you should only rank candidates you like, and don’t rank any candidates you don’t want to win. This is a misconception. Under many non-STV systems, this is a good strategy. But with STV the only reason not to provide rankings for candidates you dislike is if you legitimately dislike them all equally. If you really truly don’t care which of the bad candidates might win, then you can leave those bottom rankings blank. But in my experience, most people do have some opinions about which candidates they somewhat dislike versus those that they really really would hate to see win. If you have these opinions, it’s okay to express them on your ballot. To emphasize it again: providing rankings for your disliked candidates will never harm the candidates you truly like.

We can see how this is true by examining how votes are tallied in an STV election. The important thing to remember is that you only have one vote, even though you have many rankings that express your instructions about how your vote should be allocated. Hence the “Single” in “Single Transferable Vote”. As the votes are counted in rounds (where some candidates in each round are elected if they’re above the threshold, or some candidates are eliminated when they’re on the bottom of the stack) your vote always stays with your highest-ranked candidate who is still in the running at each round. The only way your vote would ever transfer to one of your disliked candidates is if all of your more preferred candidates have already been elected or already been eliminated. So the only time where your vote would start counting for your disliked candidates is when your disliked candidates are the only ones left in the running. No matter what you do, the election is over for your favorite candidates. At this point, wouldn’t you still want to have some say about which of the disliked candidates goes on to win? If you ranked all the candidates, you would still have some say to help elect the lesser of these evils. If you left your lower rankings blank, then you would be sitting out these final rounds of the tally.

Here’s an article from New Zealand describing STV voting strategy in civic elections, which also concludes that there’s no harm in ranking candidates you dislike: https://www.odt.co.nz/opinion/stv-voting-strategy-candidates-you-dislike

Finally, however, I want to reiterate that you don’t have to rank all the candidates. If you truly do not have an opinion about some names on your ballot, it’s fine to leave them unranked. This will not make your ballot invalid, and it will not help nor hurt your favorite candidates. If you feel like ranking all the candidates is overwhelming and might deter you from voting at all, don’t worry about it! Even if you only rank one candidate, that’s still better than not voting at all!

The point of this post is not to stress you out and make you feel like you should rank everyone. I merely want to drive home the point that you shouldn’t hold back for fear of hurting your favorites.

[crossposted to Medium and mappingmashups.net]

Location: City Center, Whatcom County, Washington, 98225, United States

Last month I gave a presentation at the North American Cartographic Information Society (NACIS) conference about getting Native Reservations to show up on OpenStreetMap.

I blogged about this previously: “It’s about time OpenStreetMap showed native lands on the map”. Now you can watch the video of my presentation on YouTube.

You can also follow along with the slides on SpeakerDeck.

Location: Downtown Tacoma, Tacoma, Pierce County, Washington, 98402, United States

OpenStreetMap US Board Election Results

Posted by Alan on 13 April 2019 in English.

[repost from the OpenStreetMapUS blog]

The OpenStreetMap US board elections for 2019 have completed! As an election observer, I was tasked with making sure the elections were impartial and not unduly influenced, and that the vote counting was done properly.

This was an unusual election in that we had two separate questions:

The first question was to fill the open seat vacated by Maggie Cawley, who resigned to take on the role of Executive Director. The second question was a simple confirmatory vote of approval for the remaining four board members. Given that there was no election held for the board back in March (because only five candidates were nominated for five open seats), the board decided it was appropriate to hold a confirmatory vote since we were already holding an election anyway for the open seat.

The results of the election are as follows:

The existing board members were confirmed overwhelmingly, with 98 voting “yes” and 6 voting “no”. In the final round of ranked choice voting Minh Nguyễn was elected to the open seat. Congratulations Minh!

Analysis

If you don’t care about the nerdy mechanics of this Ranked Choice Voting election, you can stop reading now. But if you’re interested in a deeper analysis of the results, read on:

For OpenStreetMap US elections, we use Ranked Choice Voting (RCV), which means that each voter has the opportunity to rank all the candidates in order of preference. When RCV is used to elect multiple seats at the same time, it’s also known as Single Transferable Vote (STV), and when it’s used to elect a single seat (as was the case in this election), it’s sometimes called Instant Runoff Voting (IRV).

Under Instant Runoff Voting, if no candidate has a majority of the votes at first, the candidate with the fewest votes is eliminated, and the votes for that candidate are then transferred to the second choices on those ballots. After the transfer, if there is still no candidate with a majority, then the cycle repeats: the remaining candidate with the fewest votes gets eliminated, and their votes are transferred to the highest-ranked candidate on those ballots that is still in the running. This process continues until a candidate reaches a majority of votes, or until there is only one candidate left standing.

Under our system of Ranked Choice Voting, voters are not required to rank all the candidates, so it’s possible that their ballots will become “exhausted” if there are no more candidates still in the running that have been ranked by that voter.

Here is the graphical output from the OpaVote vote tallying software, which shows the results at each round of counting.

This IRV election had some interesting characteristics. First of all, there was no majority winner until the final round, showing the necessity of using Ranked Choice Voting. Had we used a single-round plurality voting system (often called First Past the Post), the leading candidate could have won a seat on the board with only 29% of the votes. In the end, the final tally was very close, with Minh Nguyễn finishing with 51.7% of the vote compared to Daniela Waltersdorfer’s 48.3%.

Another interesting feature of this election was that Nguyễn was 2nd place in the early rounds of voting, only to come from behind to win in the final round. This is exactly the kind of outcome that IRV is designed to make possible, but in most cases where IRV is used in practice, generally the leader in the first round of voting ends up winning in the final round. It is only when there are two (or three) evenly matched candidates that IRV vote transfers end up making a difference.

In the final round, we can see that IRV guarantees a majority winner, with Nguyễn having 51.7% to Waltersdorfer’s 48.3%. But this was only a majority of votes that were still in play at the final round: almost 15% of the ballots were “exhausted” in the final round, meaning that those voters did not rank either Nguyễn or Waltersdorfer on their ballots. If we include those exhausted ballots in the totals, then Nguyễn got 44% of the vote compared to Waltersdorfer’s 41%. But we can still say that Nguyễn won a majority of the voters who still had a preference in the final round.

One last interesting feature of this election is that Nguyễn and Martijn van Exel were tied for 2nd place in the second to last round. Under the IRV rules we used for this election, in order to decide which candidate to eliminate when there is a tie, we look back into the previous rounds to see which candidate was ahead. Since Nguyễn was ahead of van Exel in every previous round, we use that information to decide that van Exel should be eliminated.

Alternative scenarios

But some variations on IRV rules (for example, the rules used by the cities of San Francisco and Oakland) specify that tied candidates should be eliminated randomly. For large civic elections with hundreds of thousands of votes, that’s probably fine because exact ties are extremely rare. But in our OSM elections it’s better to use our more deterministic way of breaking ties, since they are likely to happen more often.

But what if we had used these random-tie-breaking rules and if Nguyễn had lost the coin flip, then what would the outcome have been if it was Waltersdorfer and van Exel in the final round?

If we look at the raw votes file, we can examine the ballots and see what would have happened in this alternate scenario. See here to learn how to understand the .blt file format used by OpaVote.

To figure out what the tally would be in the final round between two candidates, we can ignore the rankings for all the other candidates, and merely look at the relative ordering of the two finalists on each ballot.

So, if Nguyễn had been eliminated instead of van Exel, we find that there are 43 ballots that ranked Waltersdorfer ahead of van Exel, and 49 that ranked van Exel ahead (with 12 exhausted ballots). So had van Exel not been eliminated in the tiebreaker in the second-to-last round, he would have gone on to win overall.

Again, this shows that in an election between three evenly-matched candidates, small differences in the rankings can produce surprisingly different outcomes.

Condorcet winner

IRV is not the only alternative voting method out there, and one of the other possible voting techniques is the Condorcet Method. From the voter’s point of view, Condorcet is similar: on your ballot you rank candidates in order of preference. But unlike IRV where we progressively eliminate candidates in a series of runoffs, under Condorcet we would look at each possible head-to-head matchup of the candidates, to find out which candidate would beat every other candidate.

If you spend enough time learning about alternative election methods, you’ll eventually hear one of the few criticisms of IRV, which is that it can sometimes fail to elect the candidate who is the “Condorcet winner”.

In our election, Nguyễn narrowly defeated Waltersdorfer in the final round, but had we used different tie-breaking rules, then van Exel would have been the one to narrowly defeat Waltersdorfer. So this left me wondering: is it possible that van Exel was the Condorcet winner, but our IRV election failed to elect him?

The way to find that out is to see who would have won in a hypothetical head-to-head matchup between Nguyễn and van Exel. Note that there are no IRV rules that would have resulted in this matchup in the final round; Waltersdorfer was ahead in every round of counting until the end, so there is no way she would have been eliminated earlier, resulting in this matchup.

If we look at the raw ballots again, we find that there are 57 ballots where Nguyễn was ranked ahead of van Exel, and 38 where van Exel was ahead of Nguyễn (with 9 ballots that did not rank either one of them). So Nguyễn would win the head-to-head matchup, making him the clear Condorcet winner, as well as the IRV winner.

Final thoughts

Again, I’d like to congratulate Minh for winning election to the OpenStreetMap US board, and I’d also like to congratulate all the other candidates who ran. One of the great things about Ranked Choice Voting is that we don’t have to worry about the “spoiler effect”, whereby one candidate choosing to run could end up splitting the vote and causing another like-minded candidate to lose. Under the RCV system, there’s no harm in having many candidates running; if anything, more candidates brings more attention to our elections and builds a healthier democracy within OSM. So for those candidates who didn’t win this time, don’t be discouraged! We hope you’ll stand again for election next year!

Aboriginal areas are finally on the map!

Posted by Alan on 17 March 2019 in English.

Late last year (around the Thanksgiving holiday in the United States) I wrote a blog post saying “It’s about time OpenStreetMap showed native lands on the map”. After that we had a few weeks of discussion and voting around the proposed tagging on the wiki (which is now approved as boundary=aboriginal_lands or synonymously boundary=protected_area + protect_class=24), and then a couple of months of refining the style proposal in the default OpenStreetMap stylesheet.

Now at long last, these features are starting to show up on the map. Here are a few examples:

Thanks again to everyone who helped get these on the map!

Why OpenStreetMap US elections should use Single Transferable Vote (STV)

Posted by Alan on 18 December 2016 in English. Last updated on 4 February 2020.

Today is the final day of the board elections for the US chapter of OpenStreetMap (OSM-US). Just a few days ago the international OpenStreetMap Foundation (OSMF) also held its elections. If you are a member of both groups, you may have noticed that the two organizations do their elections a bit differently. In OSM-US elections you just choose from a list of candidates, while in OSMF elections you rank the candidates in order of preference. What are these two systems, and which one is better? Well, I’m glad you asked…

The international OSM Foundation uses a system called Single Transferable Vote (STV). STV allows voters to rank candidates in order of preference, and produces a proportional result (meaning, for example, that 40% of the voters can choose 40% of the seats on the board). OSMF has been using STV in their last few elections, and Richard Weait wrote some detailed post-mortems of these recent elections, such as OSMF Board Election Results 2015, and the more descriptive OSMF Board Election Data 2014. He has more blog posts on STV here.

OSM-US currently uses a non-proportional Block Voting system (technically, “Plurality-at-large voting”) where each voter can choose five candidates, and the candidates with the most votes win. While this voting method is easier to implement, it requires the electorate to vote strategically, rather than expressing their true preferences. Also under this system, there is the potential that 51% of the electorate could choose all five seats on the board.

So which method is better?

STV performs better than Block Voting in a few key ways:

First, voters can express themselves more fully because they rank the candidates from their most favorite to their least favorite. Voters don’t have to make arbitrary binary choices of who’s in and who’s out.

Second, voters can vote sincerely for who they really like the most, without having to guess about whether their preferred candidate has a chance of winning or not. Because your vote transfers to your second choices if your first candidate doesn’t win, you don’t have to worry about throwing your vote away on “spoiler” candidates. STV lets you vote idealistically without giving up your chance to influence the results.

Third, every group within the electorate has a chance to elect someone who represents their views. Because STV is a proportional system, it’s impossible for a slim majority of the voters to dominate the board. The result of STV is a board that represents the full diversity of the OSM community, and is better able to resolve differences and find compromise.

The consensus of all the major non-partisan electoral reform groups (FairVote in the US, FairVote Canada, the Electoral Reform Society in the UK, and so on) is that STV is significantly better than Block Voting. None of these organizations recommend Block Voting, and all of them include STV among their most recommended options.

For these reasons, OSM-US should switch to STV elections before we vote on the next board in 2017.

Ok, but is there actually a problem that we need to fix?

It’s true that currently the OSM-US board elections are small, civil, and friendly affairs, and we do not have the concept of political parties and contentious campaigns. Right now with OSM-US our election system isn’t causing any significant problems that we can see. The system isn’t broken, yet.

In fact, there is a good chance that STV and Block Voting would produce mostly the same results in recent elections. Brandon Liu ran a simulation based on the previous two OSMF elections, and found that Block Voting and STV would have produced the same results.

Why is there little to no difference? Currently we still have a small number of candidates relative to the number of seats (roughly twice as many candidates as seats) and we don’t really have strong factions (yet), so the difference between the two systems shouldn’t be very noticeable. But we shouldn’t be complacent and assume that these the status quo will not change in the future. When factions do emerge in the electorate, we need a system that will respond well to those changes without breaking. We need STV.

Then why should we change?

As OSM keeps growing, we will probably get more candidates, and see more vote splitting and factions forming. Also, if stronger divides in opinion develop within the OSM-US community, we might see board elections that fail to represent the diversity of opinions in the electorate.

The board should be able to resolve conflicts between different factions in the community if and when they develop. To do this, the board needs to include representatives with diverse perspectives. But with block voting, there is the strong likelihood that a minority group would not be able to get any members on the board to advocate for their views.

Imagine if 51% of the electorate wanted to ban imports (just as an example), and 49% did not. If the anti-import group ran a slate of five candidates (a common practice in elections using Block Voting) they could win all the seats under our current rules. The minority would be shut out completely. Under STV, however, the minority faction would be guaranteed some seats on the board.

But STV is also great because it doesn’t require party affiliation like other proportional methods do. Voters can choose to rank candidates based on differences in their platforms, or they could allocate their vote based on regional affiliations, or gender, or whatever differences matter to them. STV produces boards that are proportional across whatever dimensions are important to the voters.

Who supports the change?

During the current OSM-US election, I asked each of the eight candidates whether they support a switch to STV or not. All the candidates who were familiar with STV supported it enthusiastically, and the others who hadn’t considered the issue before were tentatively supportive. No one strongly supports Block Voting, and the only reason we keep using it is institutional inertia.

Furthermore, the OSM-US bylaws are not prescriptive about the exact method of our elections, so it should be relatively easy for the board to switch to STV elections without any change of the bylaws. Given the apparent consensus of the incoming board members (no matter whoever gets elected), hopefully we can switch to STV before the next elections in 2017.

Even if OSM US doesn’t have problems yet, there’s inherent value in us using the most democratic voting methods we can, and being a model for best practices of self-governance. OSMF is taking the lead here, by using STV for their elections, and it’s time that OSM-US joined them.

Location: City Center, Bellingham, Whatcom County, Washington, 98225, United States

What's up with the Rann of Kutch?

Posted by Alan on 3 June 2016 in English.

I started looking at the Rann of Kutch in India, and it doesn’t look very well mapped. I also can’t find any mentions of it on the wiki, or Googling for “Rann of Kutch” in conjunction with OpenStreetMap.

Christoph Hormann’s post is the only thing I can find: http://blog.imagico.de/new-images-for-mapping-in-osm/

Does anyone know if there’s been any previous discussion (perhaps on the talk-in list?) about how to tag it? Or does the local community prefer it this way?

Here’s what it looks like now: screen shot 2016-06-03 at 3 jun 1 20 37

Which looks very different from the image in Christoph’s blog: rann

He notes in another post that it’s the largest area of incorrect coastline in the world, according to his metrics: http://blog.imagico.de/osm-coastline-and-glacier-data-quality-reports/ His map shows that most of the coastline in that area hasn’t been touched in OSM since 2007: cl_date_512

According to Wikipedia, this area is only submerged during the monsoon season, and is dry the rest of the year. So it seems like the correct tagging would be to move the natural=coastline further out, and most of the currently wet areas in OSM should be retagged as natural=wetland and wetland=saltmarsh (see wetland=saltmarsh) on the wiki. But I don’t have any local knowledge, so I’d want to be sure about that.

Here’s an overpass turbo query for natural=wetland in the area:

screen shot 2016-06-03 at 3 jun 12 55 17

There are four large polygons (one is a multipolygon relation, actually), all four of which have natural=wetland but no additional tags… no wetland=saltmarsh that I was hoping for. And mostly these features cover the current OSM land, not the incorrect water areas anyway.

I also did an overpass query for wetland=* just in case there were any polygons that had wetland=saltmarsh (or similar) and which might have accidentally left off the natural=wetland tag. But no luck, there’s basically nothing using wetland=* that’s useful:

screen shot 2016-06-03 at 3 jun 1 01 35

As a last resort, to see if there are any OSM features we can work with (perhaps someone is using non-standard tags), I zoomed into a bit of the India/Pakistan border near the coastline. There is a line of barrier islands that probably mark the true edge of the Great Rann of Kutch, which is where we should see any hidden features, if there are any. Here’s the data overlay layer: http://www.openstreetmap.org/#map=12/23.7720/68.2019&layers=D

screen shot 2016-06-03 at 3 jun 1 10 51

Pretty much all of these islands (like this one) are from the PGS import back around 2007 or 2008. screen shot 2016-06-03 at 3 jun 1 11 43

Finally, if I zoom in enough to edit, we see that the satellite imagery is good enough that someone could trace the correct edges of the salt marsh… but it would take them a bit of time to do it well.

screen shot 2016-06-03 at 3 jun 1 16 22

Does anyone have any thoughts or experience with this area?

Location: India

[Crossposted from hi.stamen.com and mappingmashups.net. Slides at http://sta.mn/dnp]

I gave a talk at AAG earlier this month, as part of a session about OpenStreetMap data analysis. I followed three presentations by some of my favorite OSM researchers, Sterling Quinn (@SterlingGIS), Indy Hurt (@IndyMapper), and Jennings Anderson (@JenningsatCU), all of them using OSM history data to see what it tells us about OSM’s past and its present. You can read more about their presentations in Diana Stinton’s article for Directions Magazine: “The simple map that became a global movement.”

My own dissertation research also looks at OSM’s history data, but for this presentation I wanted to try speculating about OpenStreetMap’s future. Specifically, what if you take a chart that looks like this, and extrapolate what happens if the number of nodes keeps going up up up:

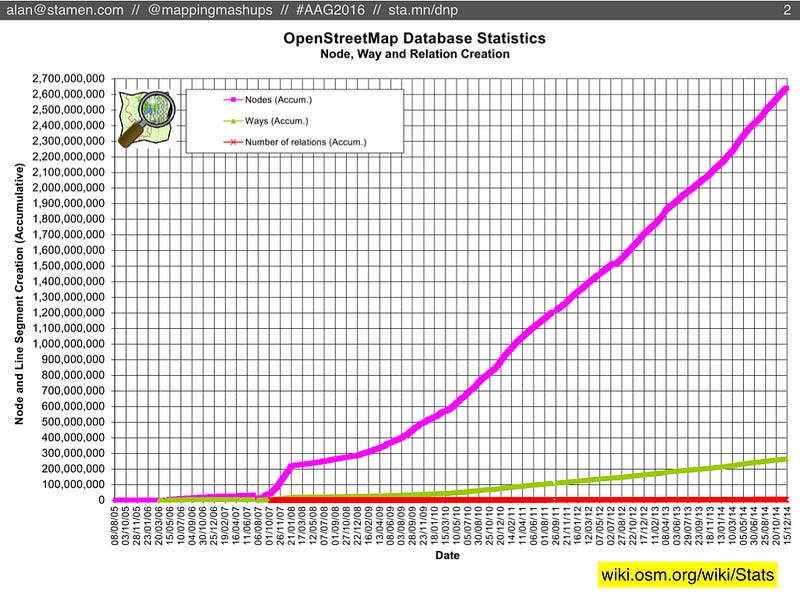
Like all of my co-presenters, we’re really not that interested in counting nodes, but we’re more interested in what those nodes tell us about the people who make up OpenStreetMap. You may have heard recently that OSM passed 2 million registered users, but the reality is that most of those people have never even edited OSM. A more meaningful statistic is the count of users who have been active editors each month. Right now the number is around 25,000 people. Smaller than 2 million, but still steadily increasing:

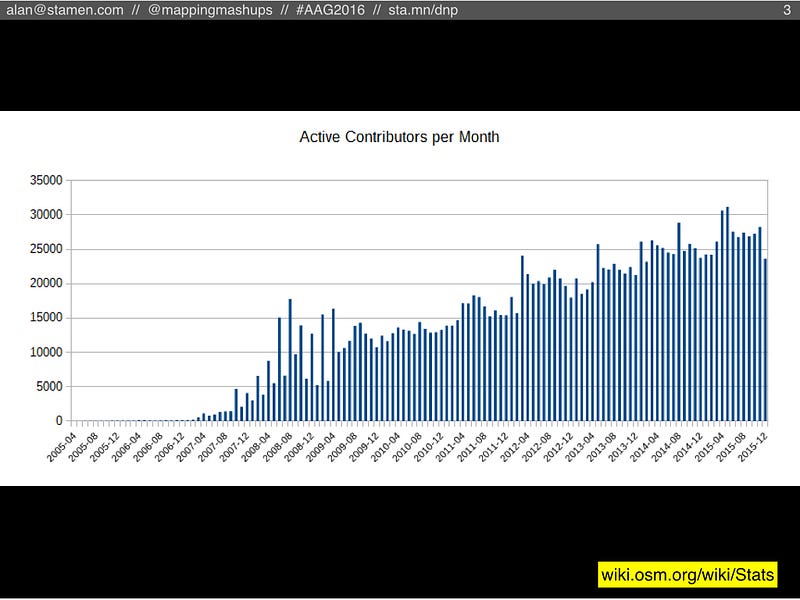
In my research I make a lot of comparisons with Wikipedia, which is a much bigger and older project than OSM, but similar in many ways. Wikipedia is also still growing in size, but if you look closely you’ll see that the rate of new articles has been slowing down for a long time, since 2007 approximately.

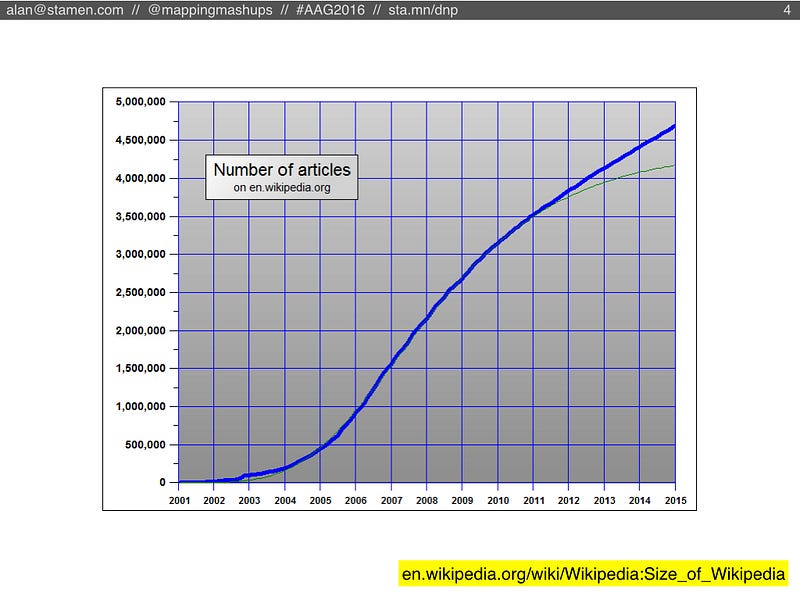
The same thing is true about Wikipedia’s users. Their monthly count of active editors has been dropping since 2007. A smaller number of people is doing more and more of the work.

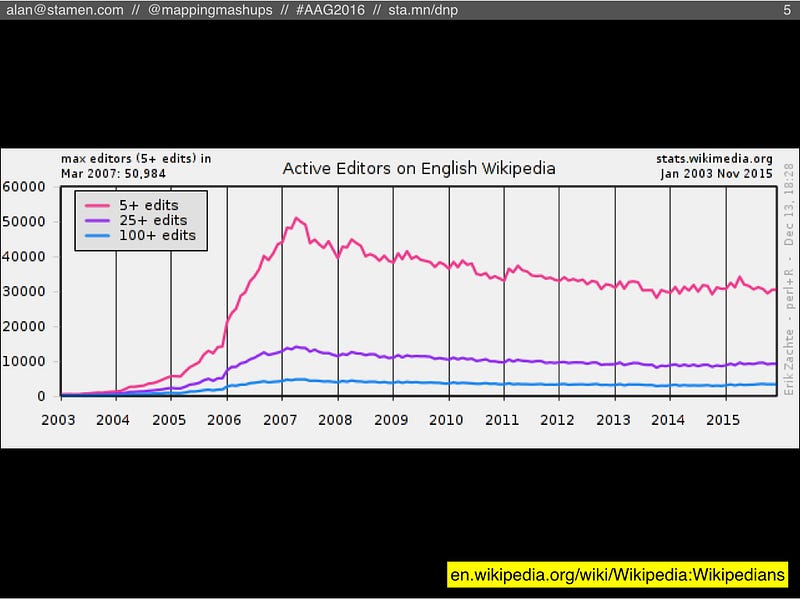
If you talk to Wikipedia researchers, they’ve been freaking out about this statistic for a long time. Nobody knows exactly why it’s happening. It’s probably caused by a variety of factors, and one possibility (to simplify things greatly) is that the Wikipedia community has become increasingly unwelcoming and difficult to become a part of. Or at least that there are enough difficult people to deal with that it drives away new contributors. (Those who have been active in the OSM community might notice some parallels here.)

Another possible reason is Wikipedia’s Notability Guideline. Basically, Wikipedia has come to a consensus that there are only some topics that are notable enough to be in an encyclopedia. Any new articles that aren’t considered notable are candidates for speedy deletion. 
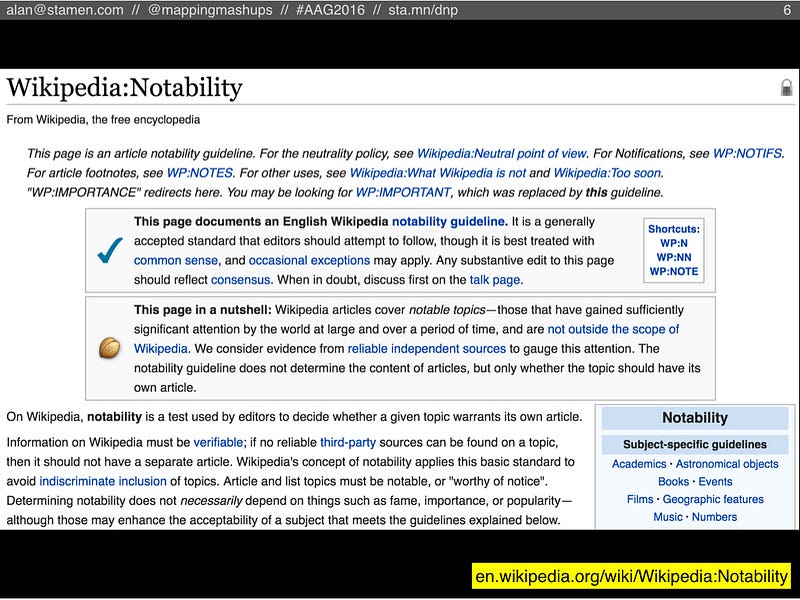
Of course, there are many Wikipedians who argue that Wikipedia shouldn’t be held to the standards of a traditional encyclopedia: there are no space constraints because it’s not printed on paper, so why not have an article about basically everything, notable or not?

These two factions became known as Inclusionists and Deletionists, and pretty much everyone agrees that the Deletionists won. 
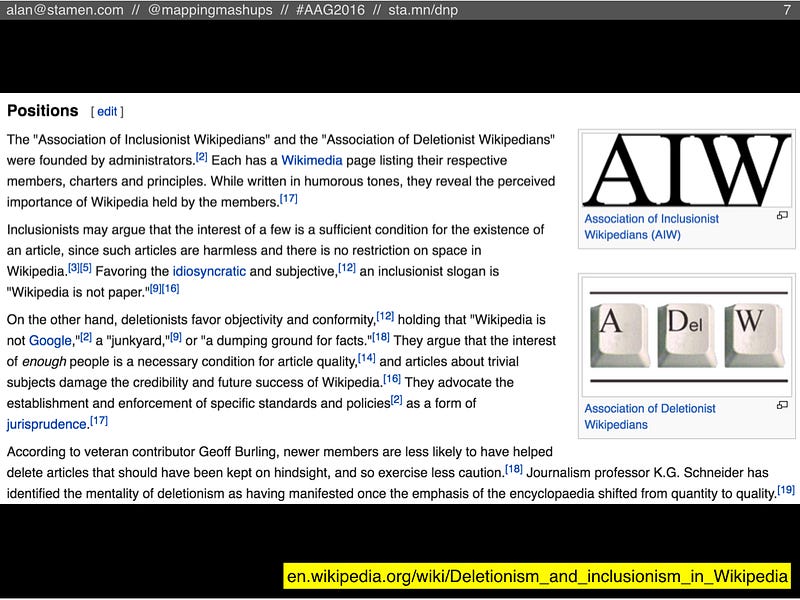
However, this is one of the key places where OSM differs from Wikipedia. OpenStreetMap has no notability rule! An arbitrary amount of detail is theoretically possible. When you’re done mapping roads, you can start mapping sidewalks. When you’re done with sidewalks, you can map mailboxes, trees, and benches. Nobody knows where the level of detail will end.

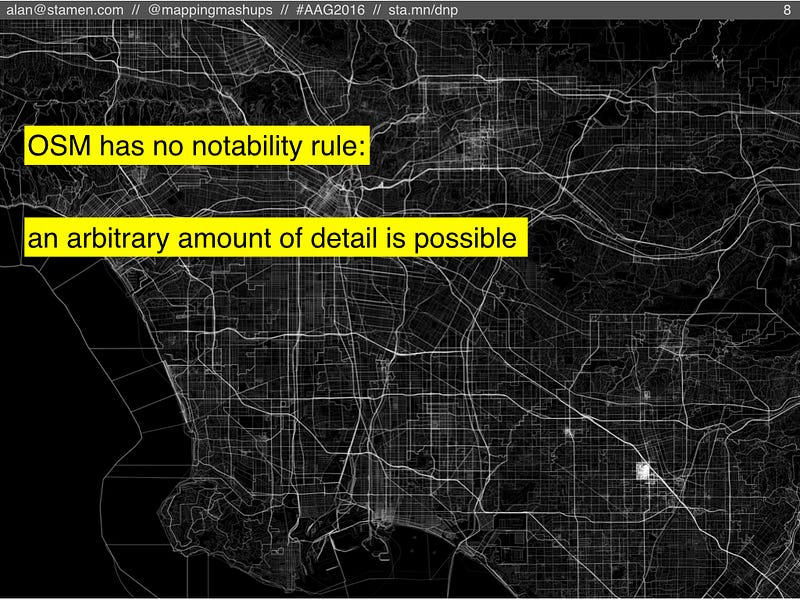
But if OSM allows this much detail, somebody has to maintain it! 
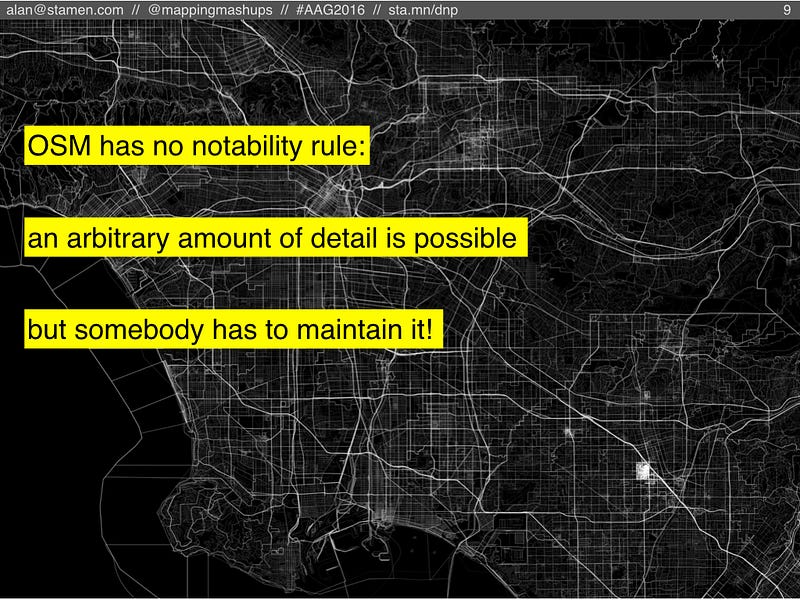
This question of maintenance is the key focus of my dissertation research. Who maintains OSM? Are they the same people who mapped the roads to begin with, or do different people come along to do maintenance? Is there enough maintenance happening to keep OSM up-to-date?

In my research I call this “map gardening”, borrowing the concept of “wiki gardening” from the community of wikis (Wikipedia being only one of these). A wiki gardener is someone who doesn’t necessarily write new articles, but instead enjoys fixing typos and grammar in existing articles, fixing up formatting and broken links, basically doing all the thankless and unsexy tasks that are necessary to keep a wiki functioning. Presumably a similar “map gardening” must exist in OSM, so what does it look like? 
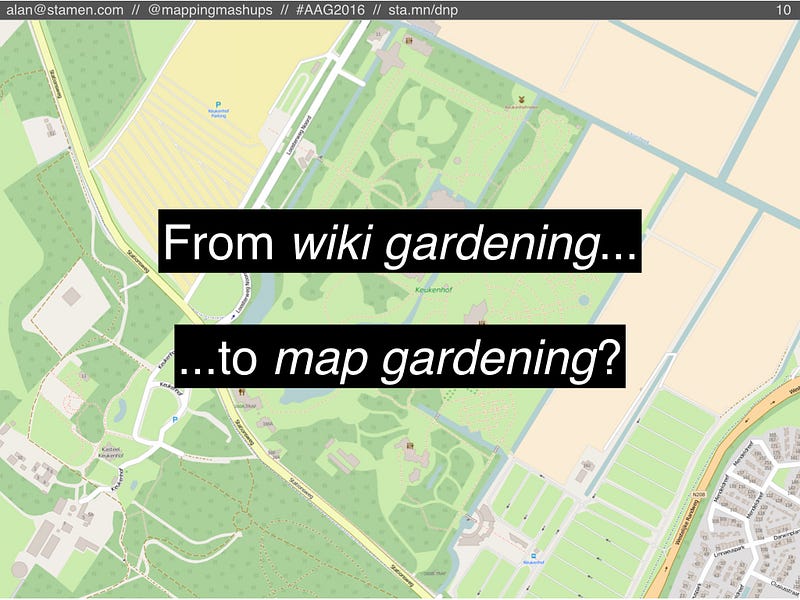
And what does it look like going into the future? Here I’d like to step back, way back, and borrow an analogy from cosmology, the study of the life and death of the universe. Following the Big Bang, the universe expanded rapidly. After a while, the expansion slowed down, but recent studies have found that it’s actually speeding back up again. Cosmologists think there is something called dark energy that is causing this acceleration, but nobody knows how much dark energy is out there. If it’s a lot, then the universe will keep expanding and eventually even molecules and atoms will be torn apart. This is called the Big Rip. If there’s not much dark energy out there, then eventually gravity will overcome it and the universe will collapse into the Big Crunch.

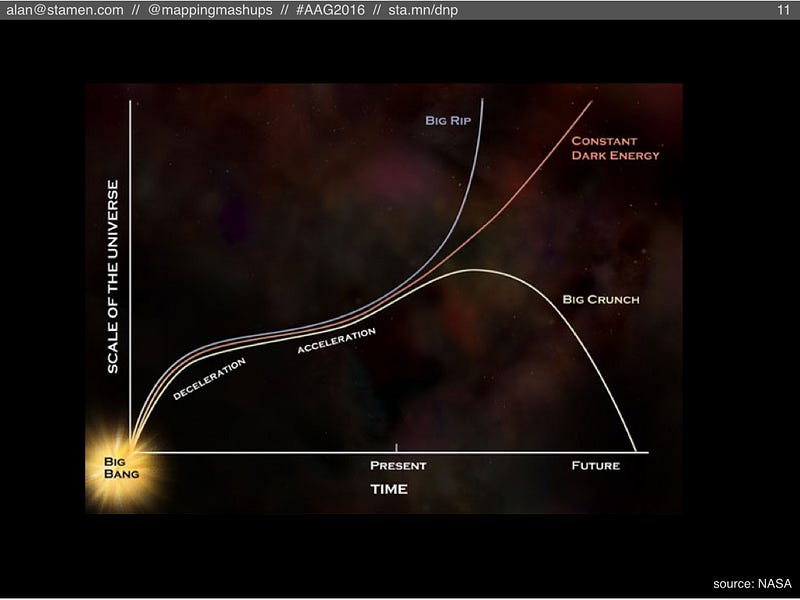
So what are the “cosmological” futures for OSM? The number of new features (points, lines, polygons) could keep increasing, or maybe that pace will slow down or stop entirely. Similarly, the amount of maintenance edits (those “map gardening” tasks) could keep growing, or they could slow down to a trickle. The balance between those two activities could lead to the OSM equivalent of a Big Rip, a Big Crunch, or something else entirely.

Here are (at least) four scenarios that might occur:

But before we look at those scenarios, here’s a chart (not with real data, yet) that illustrates the possibilities. Note that this chart is different from the cosmological chart that I just showed. Instead of time along the bottom axis, this is a cumulative chart where time moves somewhere up and to the right.

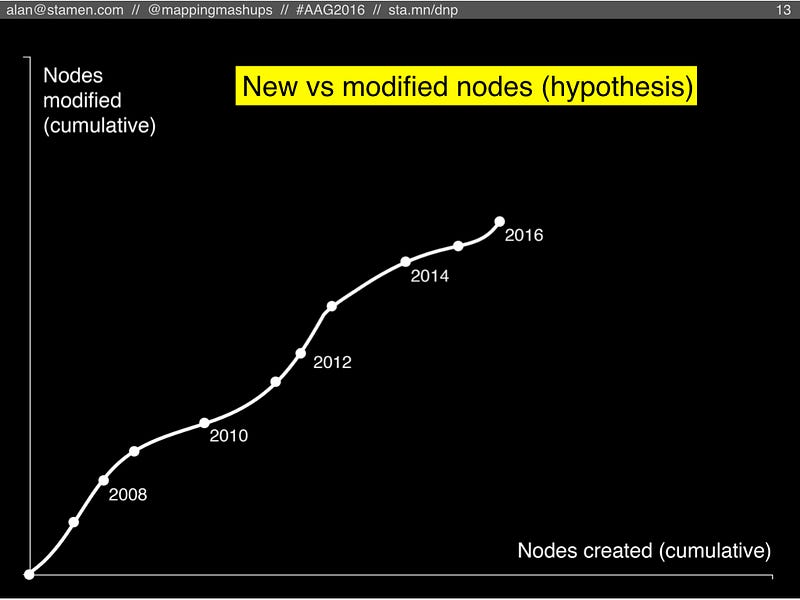
As people create new nodes in OSM, the dot moves to the right. Every time someone edits an existing node, the dot moves upward on the chart. Because it’s cumulative, the line will never curve downward, or bend backward to the left. Each year’s worth of edits moves the dot some amount right, up, or both. (Also note, for simplicity’s sake I’m ignoring all the lines and areas in OSM, and only looking at the raw points, which OSM calls “nodes”).

Now let’s look at the four scenarios.

#1. Ghost town

Our first scenario is the “Ghost town”, where new nodes slow down, and so do the modifications. Basically, this is what happens if everyone gets bored of OSM (or if community disfunction causes everyone to leave).

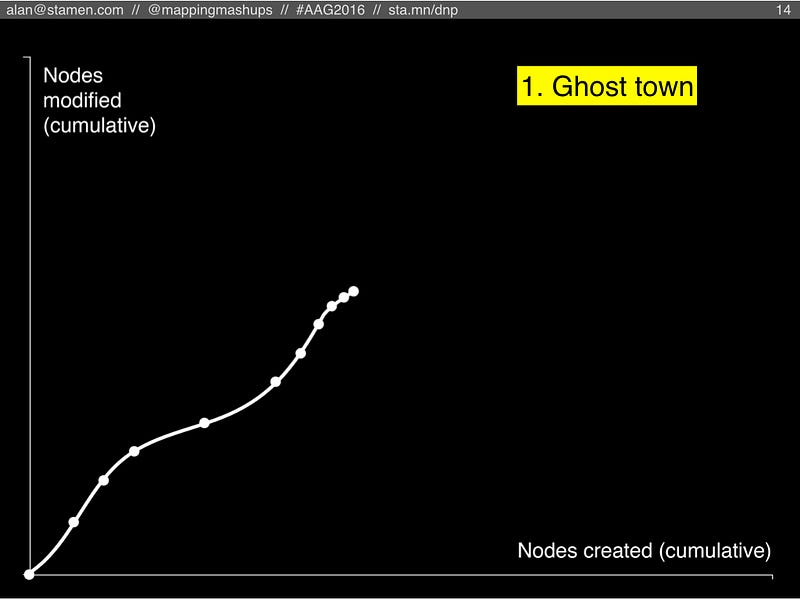
It wouldn’t necessarily look like this: (although this is the first result when you search for “ghost town” in OpenStreetMap).

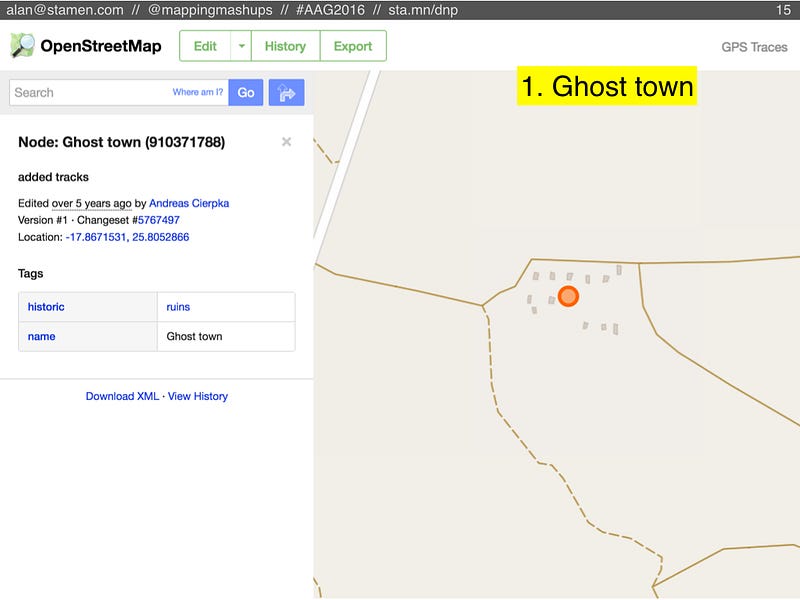
In fact, the Ghost Town scenario might look like a fully complete street map. But it would be slowly getting out of date, and no one would be increasing the amount of detail. It would become a snapshot in time.

#2: Garden

The second scenario is what happens if people stop adding new features to OSM, but they continue to edit them and keep them up to date. Maybe this would happen if OSM institutes something like Wikipedia’s Notability Rule. Perhaps OSM decides that streets and addresses are good to have, but trees and mailboxes are too much detail.

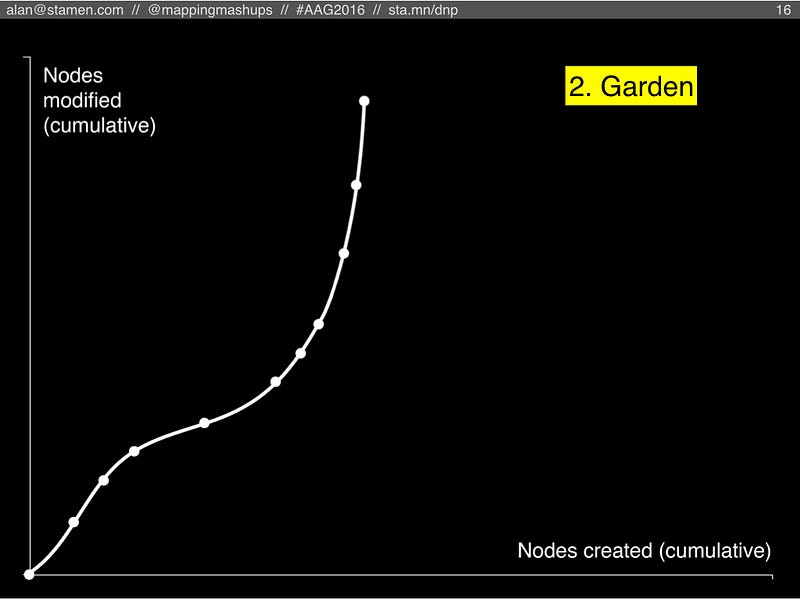
But this scenario requires a large community of OSM editors who enjoy maintenance. There will always be new buildings built and old ones torn down, roads that are widened or redirected, river banks that change their course. All of these things need to be updated in OSM if it’s going to stay useful.

For example, here’s a nice garden in OSM, next to some well-mapped riverbanks that will be shifting and changing year after year.

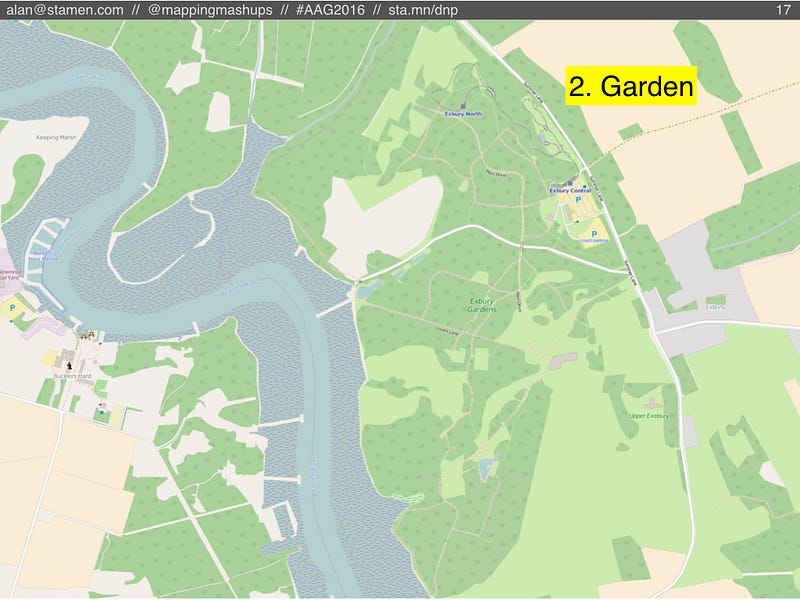
Here’s another lovely garden. (Of course, I’m talking about all kinds of OSM features, not just literal gardens… but if you do find any nice examples of gardens in OSM, please send me a tweet!)
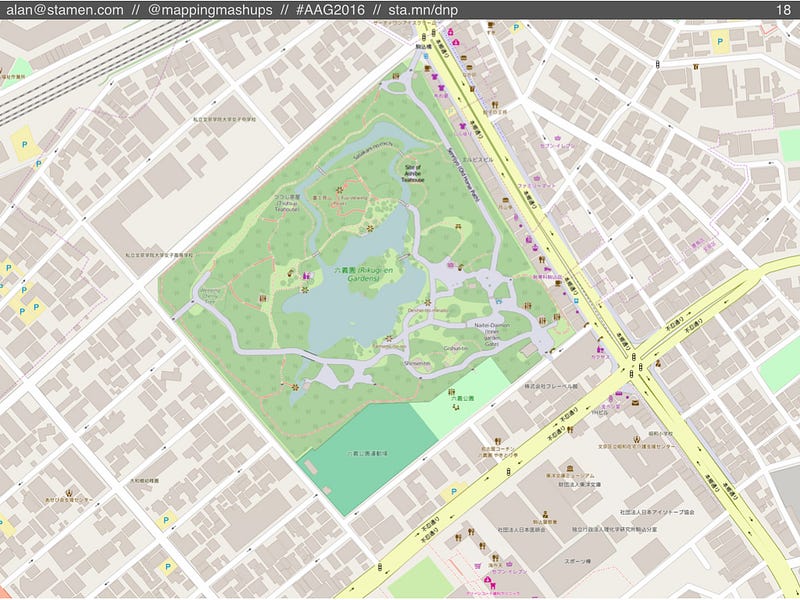
#3: Borgesian map

The third scenario is what happens if people keep adding more and more detail to OSM, but nobody can keep up maintaining it.

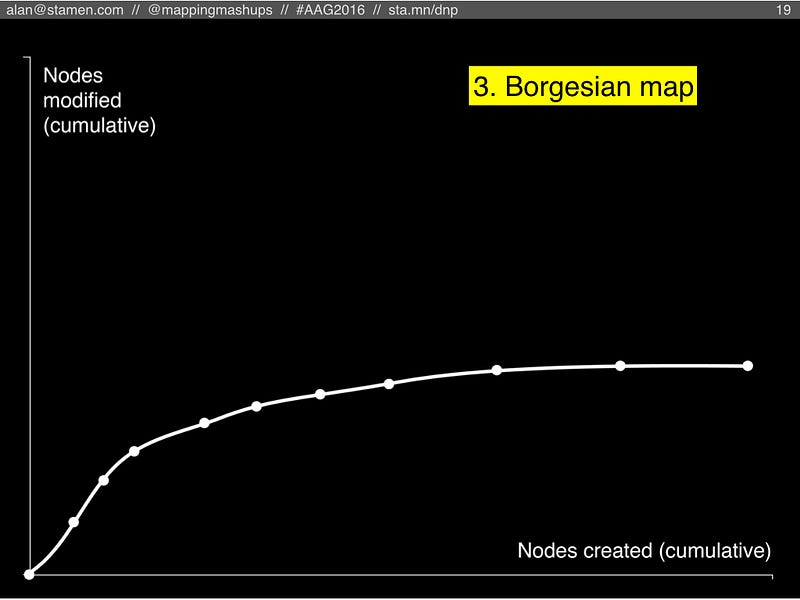
In this scenario, eventually everyone has mapped all the streets and sidewalks, and they start mapping every tree and shrub, maybe even every blade of grass (to borrow Harry Wood’s “most insane” example from his 2011 talk at State of the Map about OSM as a garden).

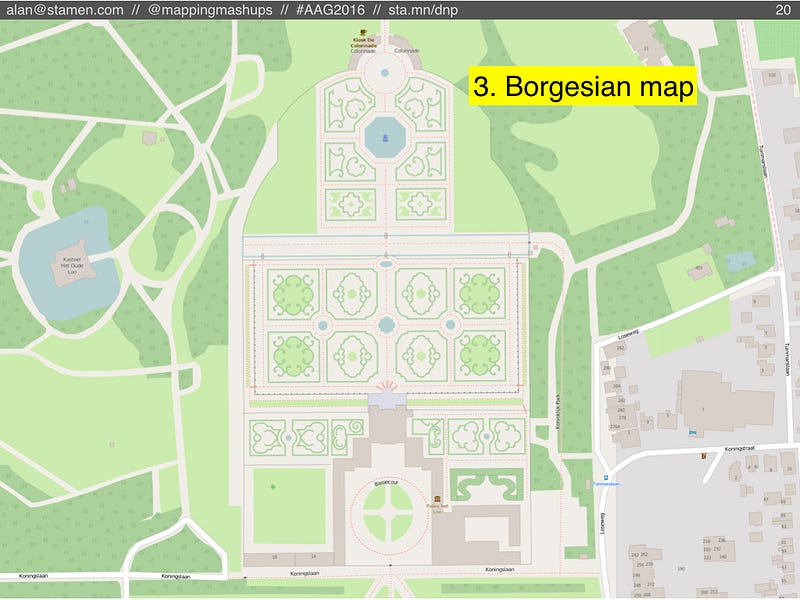
Eventually, OSM would approach the 1:1 scale map described by Lewis Carroll, and later in a short story by Jorge Luis Borges. In Borges’s story, cartographers succeeded in creating a 1:1 map, only to find it impossible to use. Eventually they abandon the map, parts of which can still be found scattered about in the desert.

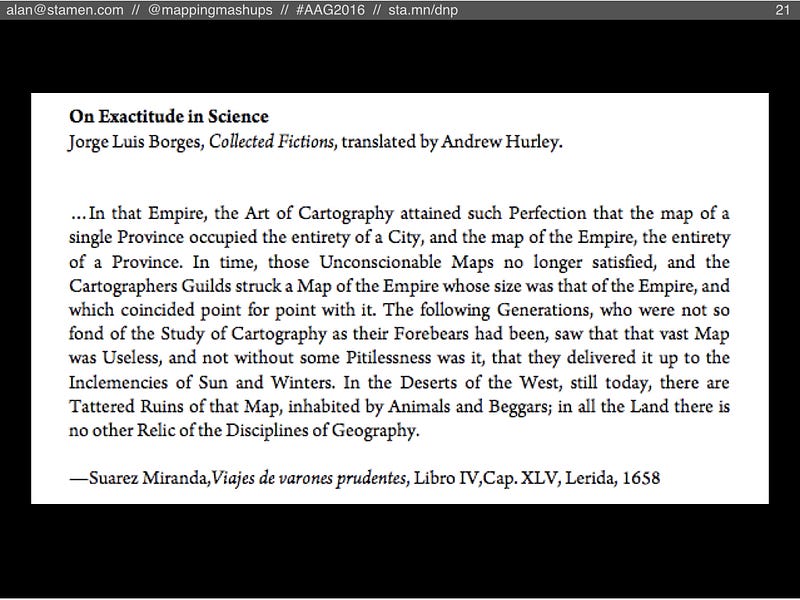
In OSM, a 1:1 map without enough maintenance would be equally useless. It might not be fully abandoned, as people keep adding more and more data, but everything they did add would become out-of-date and impossible to verify. The OSM database would be cluttered with useless information.

But we’re probably not yet at the limit of detail that is both useful and (potentially) maintainable. OSM already has some proposals underway about mapping roads as areas instead of lines. Here’s an example of some municipal data (not from OSM) visualized by Lou Huang at Mapzen, showing curblines maintained by the city of Philadelphia. I won’t be surprised is OSM volunteers start adding data at this resolution.

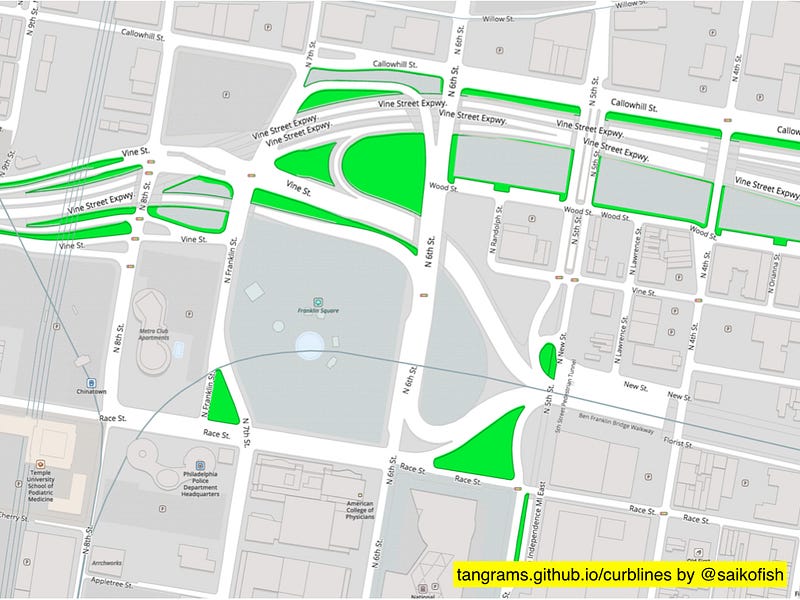
But then where do we stop? As another example of municipal micromapping, here are the outlines of all the street markings painted by the city of Cambridge, Massachusetts. Surely some amateur mapper in Germany with too much time on his/her hands is thinking about how to tag features like these in OSM…
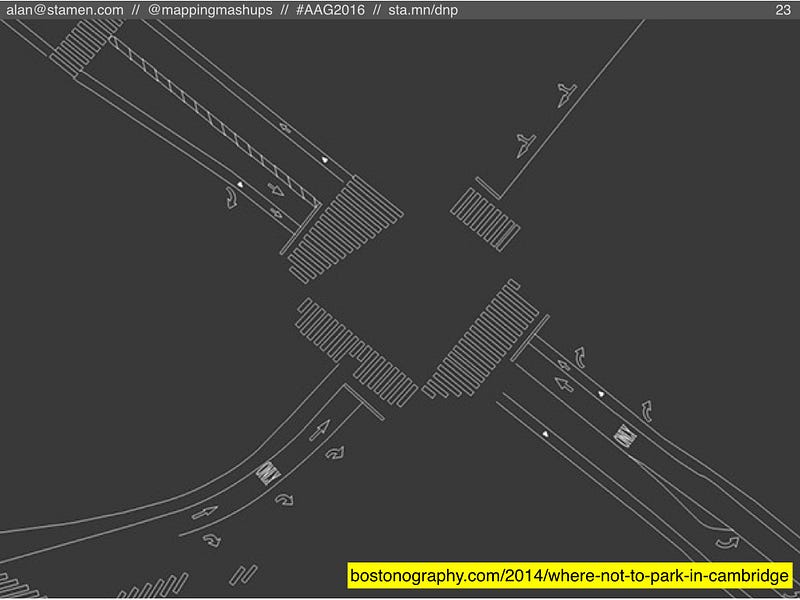
#4: Singularity:

But what if Borges’s 1:1 map doesn’t get abandoned to crumble apart in the desert? What if, somehow, OSM keeps adding features, but the community keeps maintaining those features too? What if OSM didn’t just have 25,000 monthly editors, but actually did have 2 million or 25 million editors checking OSM and fixing data every day?

I’m calling this scenario The Singularity, but you’ll have to excuse me for mixing my metaphors. I’m not talking about a cosmological singularity like a black hole, or the Big Bang. Instead I’m borrowing from Ray Kurzweil’s idea of rapidly accelerating computational power and information growth. Partly I like this concept because the singularity is the point past which we can’t predict or imagine what would happen, and I can’t really imagine what OSM would look like if it were a constantly-maintained 1:1 map. But Kurzweil’s singularity is also relevant because OSM probably couldn’t achieve a perfectly up-to-date 1:1 map without the help of algorithms and machine intelligence. But that’s a topic for another presentation.

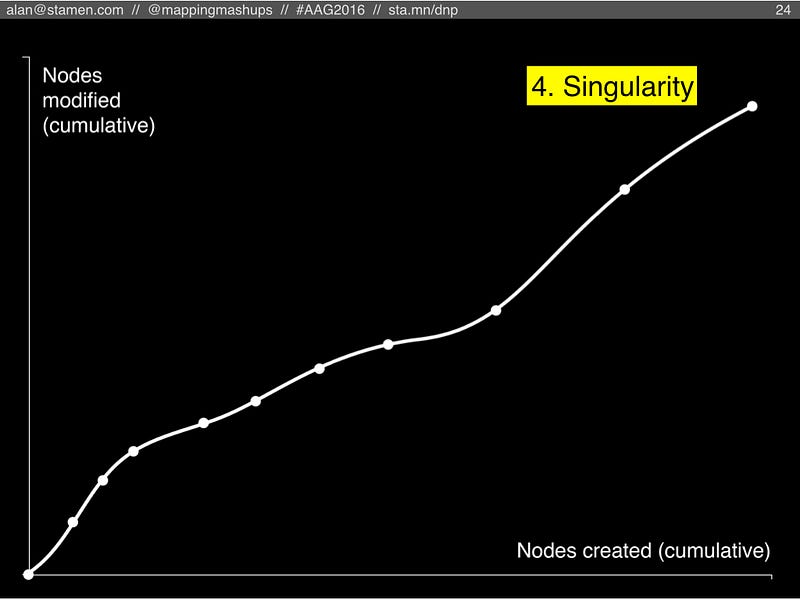
Who knows what that would look like? The gardens of Versailles in OpenStreetMap are the most detailed gardens I could find, but this level of detail might only be the beginning.
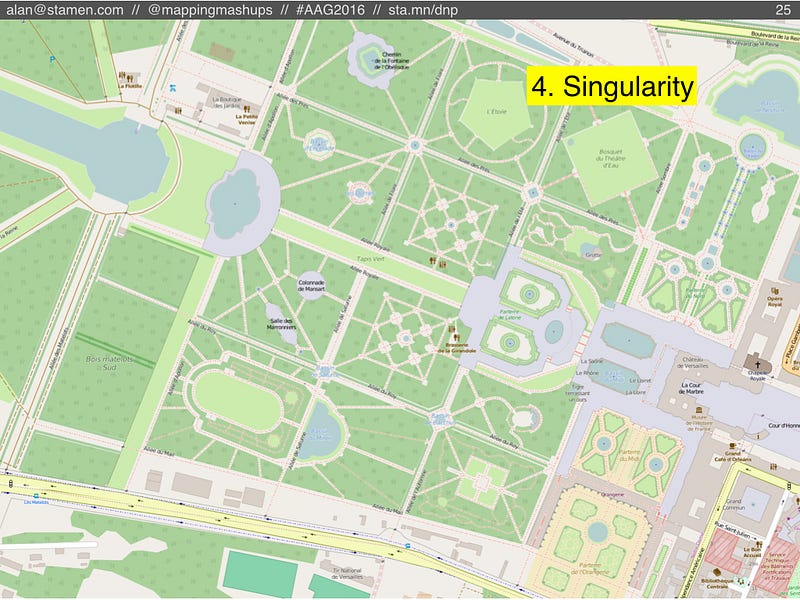
Reality

So we’ve spent a lot of time speculating about what these different scenarios might look like, and I’ve shown charts that illustrate how we might see those scenarios manifest themselves in the data. But what does the real data look like?

Here’s the chart showing the OpenStreetMap planet file, from the earliest OSM nodes around 2005, up to January 1st 2016. The line shows the cumulative count of nodes created and nodes edited for each month, with dots every January.

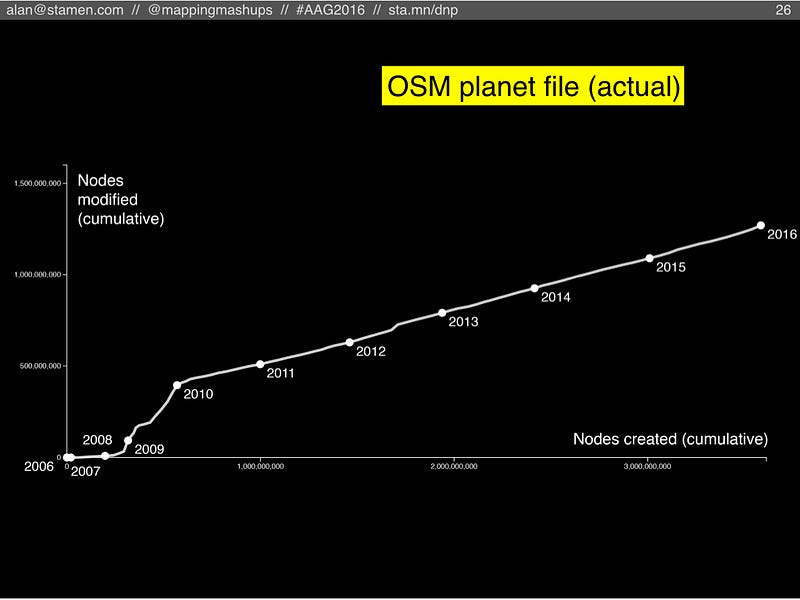
There are a few surprising things about this chart that I didn’t expect to see. In the first few years, we see mostly new nodes added, and not a whole lot of modified nodes; that’s to be expected. You can see there were more new nodes in 2007 than there were in 2008, mostly due to the TIGER data import that happened in late 2007. Then in 2008 and especially 2009, we see a significant number of modifications. I’m not sure what was happening during this time to explain this burst of gardening. It doesn’t correlate exactly with changes in the OSM data structure (which might require fixing features that were incorrectly translated from one datatype to another), and it doesn’t match up with the availability of new higher-resolution satellite imagery (which might have triggered spurts of gardening where people would improve the geometry of poorly-traced roads). That early spike of gardening certainly merits more research.

The other striking aspect of this chart is the steady, smooth line from 2010 to the present day. It’s shocking to think that when you sum up all the editing activity all over the world in OSM, it always adds up to the exact same ratio of new features to modified features. From 2010 onward, every month in OSM, there were roughly three new features for every one modification of a feature. Did OSM stumble upon some perfect, magic balance that will be maintained forever? What is special about that ratio?

But if the study of geography teaches us anything, it’s that you can’t look at the whole world as a homogenous system. We need to zoom in on the local dynamics of the OSM community, not just look at the planet file as a whole. How has OSM evolved on smaller scales?

Here’s London, the place where OSM got started. It follows a similar path as the planet does overall. But if you look closely the spacing between years, it starting to slow down (even while the ratio between node creation and node modification is staying steady). Is London pulling back from a course towards the singularity? If it slows down too much, will it become a ghost town? Maybe the map of London is getting close to being “finished”?

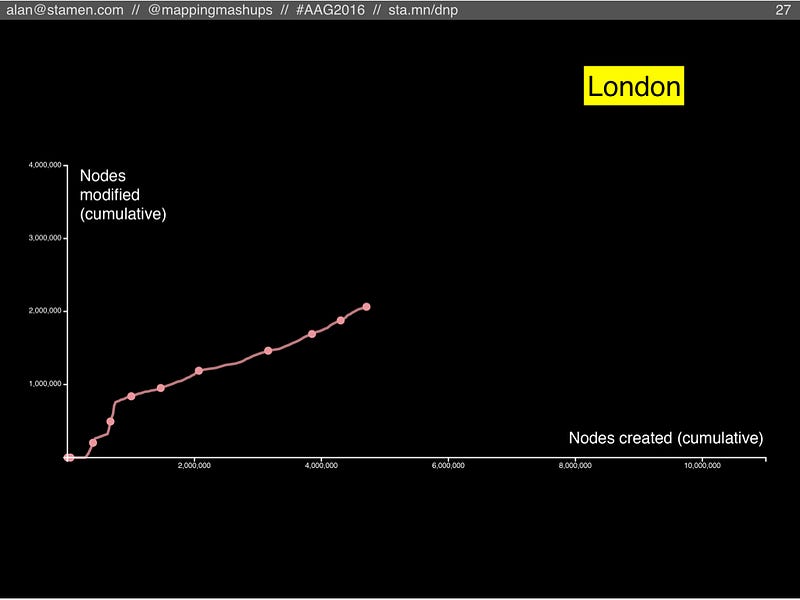
However, if we look at Berlin, another extremely well-mapped city with a strong OSM community, we see something different. In the last two years, when London slowed down, Berlin sped up! Here they are still finding new things to map.

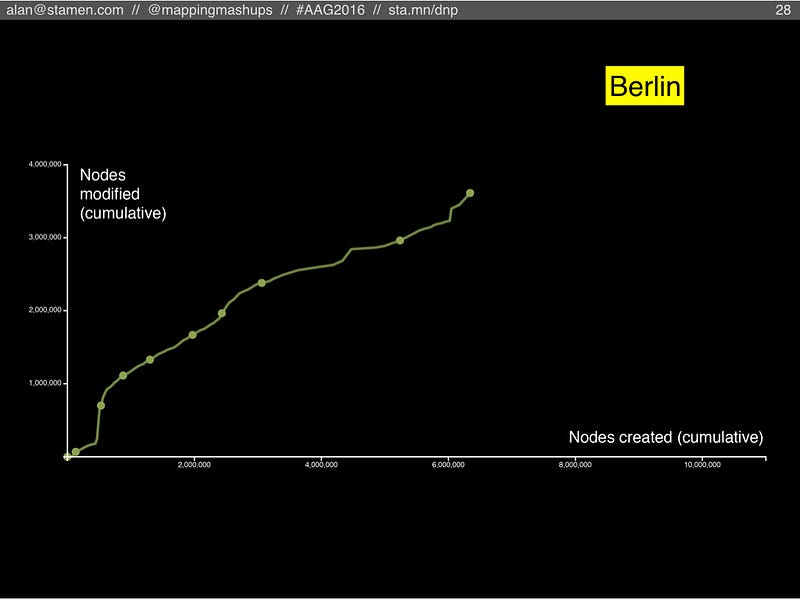
Tokyo is also still adding new features, although it might be slowing down a bit, like London. But one key difference between Tokyo and the first two is that the number of modified nodes is significantly lower compared to created nodes (the chart is further down toward the right). Tokyo is more on track to become a Borgesian map.

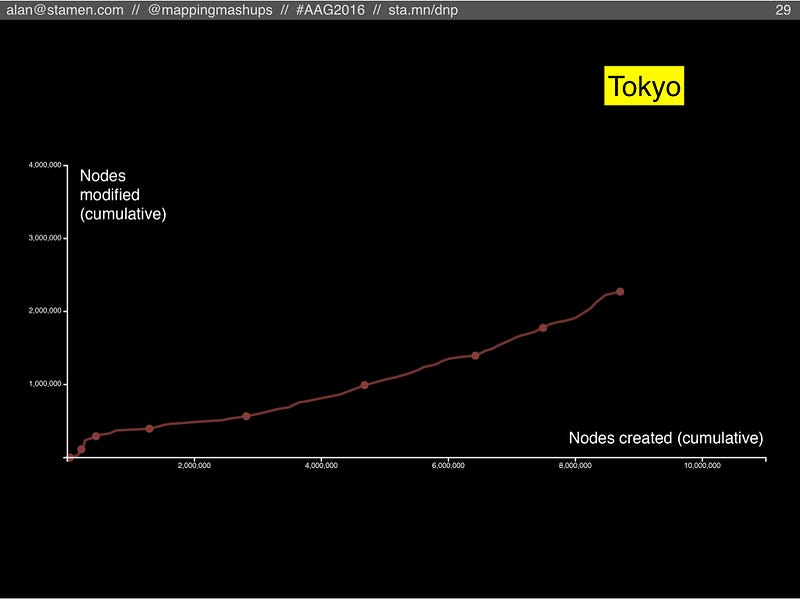
In a place like Port-au-Prince, Haiti, we can see the signature of an intense burst of humanitarian mapping after the 2010 earthquake. We also see sporadic bursts of subsequent activity: in some years there is almost no activity, but in other years there is a lively pace of new features with a bit of maintenance. This is an example of a place where a community is struggling to take root and avoid becoming a ghost town.

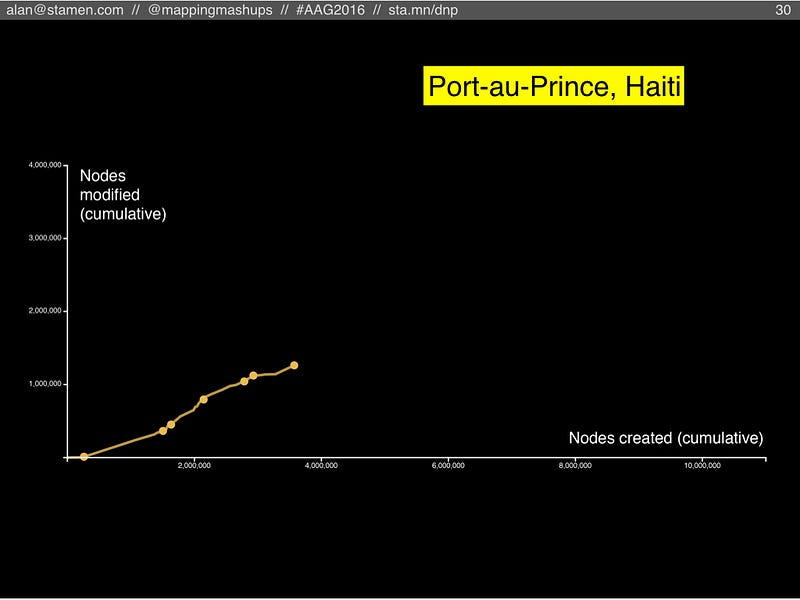
In San Francisco we can see the early influence of the TIGER import (the first year which is flat against the X axis: all new imported nodes, no maintenance). But in later years we see a strong and growing rate of activity: in relative terms, the TIGER data is just a blip, far in the past. More worrisome is the trend of the line, bending more towards the right instead of upwards. If San Francisco doesn’t increase the amount of gardening edits, all this rich data will become out of date and obsolete.

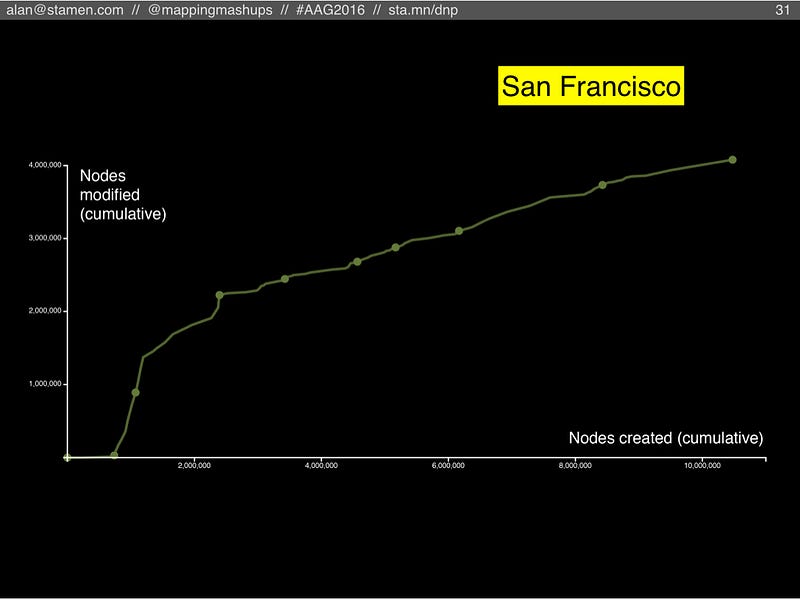
Finally, Moscow. Another well-mapped city with a strong community, similar to London or Berlin. But of all the cities we’ve looked at, the slope of the line is the steepest: Moscow has its own blend of node creators and node maintainers, with significantly higher rate of maintenance than anywhere else! Is this a cultural difference within the OSM community? Does it mean Moscow’s map is more up-to-date and better maintained? It will be fascinating to find out! 
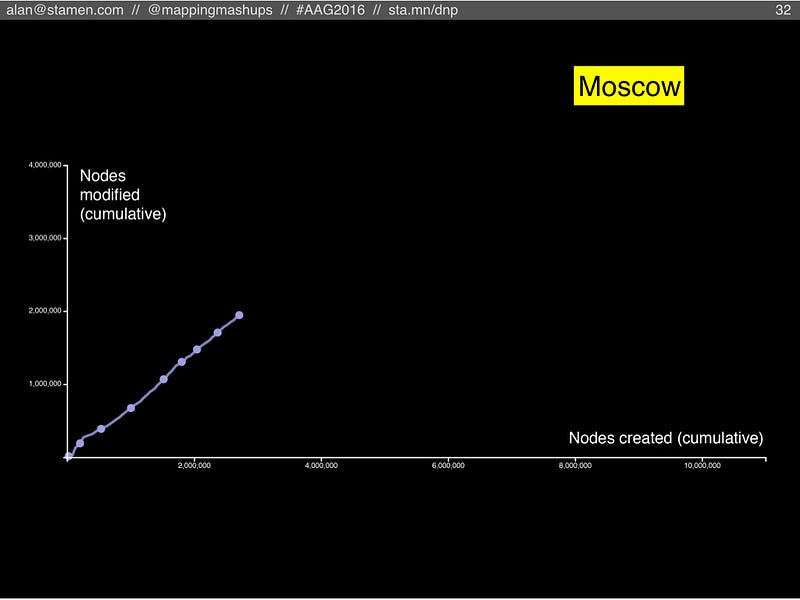
Finally, these charts can’t really tell us anything about how much maintenance is necessary to keep OSM at some minimum level of quality. But we can start thinking about what that equation would look like. We know there are at least two reasons why we need maintenance: to fix human error in the node creation process, and to keep OSM up-to-date to reflect changes out in the real world. The human error rate is a function of the number of new nodes (and also errors during the process of maintenance, we can ignore those for now), while the rate of real-world change is a function of the number of features in OSM that reflect features in the real world. If OSM decides to include features for blade of grass, that’s a lot of maintenance edits that will be required whenever someone mows the lawn.

Here’s what a first stab at that equation looks like. All the values are unknowns at this point, but one thing is clear: “map gardening” shouldn’t be and can’t be just an afterthought. In the long run, without maintenance OSM won’t add up to much.

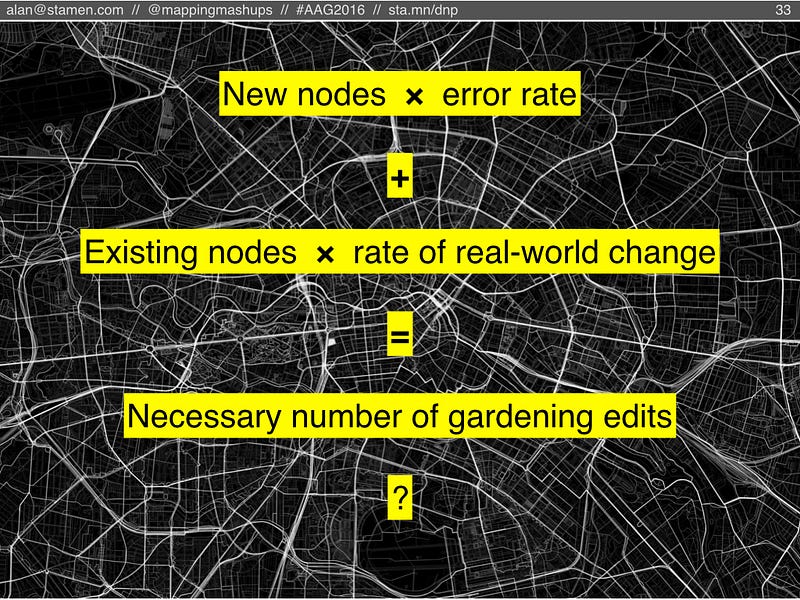
I would love to hear what you think about this research. Please get in touch!

UPDATE: Bill Morris was quick to give an opinion: “I’m definitely voting ‘Borgesian map’ as the likely outcome here.” …which made me think, I should do a twitter poll. So let me know what you think will happen with OpenStreetMap. Remember that it might be years or decades before we know for sure: [twitter link]

Location: Union Square, San Francisco, California, 94104, United States

San Francisco data imports, anyone?

Posted by Alan on 7 July 2015 in English.

Thanks so much to the Mapbox Data Team who traced all the building footprints in San Francisco, California last year!

However, I think it’s time to start giving our buildings the next bit of love: addresses. I checked and found a stagnant import proposal from 2010. Maybe it’s time to reboot that? If you’re interested in importing addresses for San Francisco, join in the conversation on the San Francisco Address Import wiki page

The other thing that our buildings lack is height data. Perhaps we could import that too? I started a page for that discussion here: San Francisco Building Height Import. Feel free to let me know if that’s a terrible idea.

Location: Mission District, San Francisco, California, 90103, United States